Publish Date - May 16th, 2021
|Last Modified - September 14th, 2022
Microsoft Excel is a great tool, which has been used by millions of professionals in dozens of industries for over two and a half decades. If you’re new to Excel, you’re in for a treat because Udemy has some amazing online courses in Excel. That’s because Microsoft Office’s applications seem to be endless – this includes Excel!
In a world that’s becoming increasingly automated and data-based, it seems like Excel is at the cornerstone of every enterprise business. As I’m a lifetime learner, I’ve ventured to look for the best Excel Udemy courses so that you can make the right decision with your money when choosing a course.
Note: All Udemy courses (even the most popular Udemy courses) haves a money-back guarantee, so even if you don’t like the course – you can return it right away. Many MooCs (Massive open online courses) provide this. eDX, Lynda (LinkedIn learning), Coursera and Udacity all have this money-back guarantee if you’re paying for their products. There are affiliate links below to Udemy and other parties that I may receive commissions from. However, I highly recommend these products due to the fact that I’ve audited or taken them before. Please click through and support my website so that I don’t need to run Ads :).
Quick summary of top Microsoft Excel courses on Udemy for 2021
About this Udemy Excel guide and review
Overall, this guide is meant to educate you on what courses to take for Excel and provide a quick, succinct overview of each course, what users think about it, and if the money is worth it. It’s useful to note that Udemy offers discounts quite regularly (so many that the security exchange commission (SEC) could call into question their “actual price”), so the average cost of each Udemy course is between $12.99 and $21.99 USD. If you’re interesting in Udemy more, feel free to check out my “is Udemy worth it article?”. I’ve also audited PMP courses on Udemy, web development courses and SQL courses!
For most of these courses, I’ve viewed a few lessons from each, compiled information from other websites, and looked at reviews to determine if they’re a good purchase.
However, for the Best Overall Excel Course – Microsoft Excel from beginner to Advanced. By Kyle Pew and Office Newb – I actually spent the time and audited the course, completing all of its sections and assignments. This resulted into getting a Udemy certification for it. I also have an excel specialist certification from 2013, so I am no stranger to the intricate nature of Excel and all if its nuisances. Further down below in this guide is Kyle Pew’s Udemy course – I hope you find it as fun as I did!
1.Best overall Excel course: Review of Kyle Pew’s ‘Microsoft Excel – Excel from Beginner to Advanced’
Course overview
Kyle’s course is meant for a variety of different users. From beginners to advanced super users, with Kyle having been an Excel trainer for the past 10 years – he is an absolute expert in all things Excel. Overall, the content is clean, well-written, and will teach you enough to probably pass some of Microsoft’s more basic Excel certifications.
| Specs | Information |
| Overall Rating | 4.7 (12.5+ ratings) |
| Amount of Students | 58k+ registered |
| Length | 11 hours+ of videos |
| Downloaded Resources | 26 |
| Languages | English, Indonesian, Italian, Polish, Portuguese, Romanian Spanish. |
| Cost (USD) | $12.99 – $17.99 (when on sale) |
| Requirements / pre-requisites | Basic function skills with Excel is a nice to have. Should work with Excel versions 2016 and above unless spoken. |
| Excel Versions covered | 2010, 2013, 2016, 2019 and office 365. |
Some of Kyle’s course testimonials
I enjoyed this course, I followed along and discovered a lot of useful Excel tools and features. I would have given it 5 stars if not for two drawbacks. First, the VBA course was a little too short. When I tried to use VBA to automate a daily report at work, I had to look for a lot of information on the Internet and it turned out that I am still not familiar with some basics, which I had hoped to discover during the course. Second, it would have been nice if there had been tests after each section, as it would have helped to revise lectures and to better control my progress. But overall, a great course! I really recommend it.
Yuliana Varfolomeeva – February 2021 – 4.5/5 stars
This course is good and while many (if not most) of Excels useful features are introduced, this course only provides a quick flyover of each one before moving on to the next feature. This is perfect if what you’re looking for is to get a general idea of all that COULD be done with each feature. To actually get a good handle of each feature and be able to use it in a real life setting will require a lot more studying and practice problems than what is provided so don’t expect to be a true Excel expert after just completing this course. It is very good for a complete newbie to understand just how powerful Excel is and all that can be done with it though, which is exactly what I was searching for. Thanks Kyle!
Kendall Stenlund – January 2021 – 5/5 stars
This is an excellent course! Kyle’s teaching style is well paced, demonstrated clearly, and the Q&A section is highly active with questions/queries being answered within an hour or so. I already had a good working knowledge of Excel but I even learnt a couple of new tricks in the beginners section! The lifetime access will be incredibly useful to back through and refresh my knowledge if there are elements that I don’t use so often. The structure is super easy to navigate through. If I was to change anything about the course, I would add more quiz sections. Breaking up the segments with a quiz to test my knowledge really helped to keep it in my head while also providing a summary of the section. Thank you so much for this course! It has helped me so much! 🙂
Grace Battye – December 2020 – 5/5 stars
What you’ll learn
- Handling large data-sets and creating spreadsheets
- Managing large sets of data using filters, sorting, conditional formatting, and other built-in Excel tools
- Data validation, inserting of tables, chats and other assets into Excel
- Pivot tables, Pivot charts and PowerPivot (favourite one)
- Normal functions (sum, average, count, and their D counterparts (DSUM, DAVERAGE etc.))
- Lookup functions (HLOOKUP, VLOOKUP, index, match)
- Text-based functions (LEN, concatenate, search)
- What if analysis (goal seek, solver, scenario creator)
- VBA and macros
Overall recommendation and final remarks
This is an amazing course that will really help you understand the inner facets of working with Excel in 2021. Kyle Pew is a fantastic instructor with a tremendous amount of charisma, skill, and aptitude in all things Office-based. If you’re looking for the perfect, full Udemy course, this is the one for you to get on board with. If you’re looking to just brush up on your Excel pages or content, want to learn the basics of VBA, or have no skills in Excel and are learning from scratch – this is one of the best Udemy courses you can get.
Pros:
- Very comprehensive – goes into great detail for certain functions and tools in Excel
- Great worksheets and exercises, easy to follow, and quite useful in practical sense
- Realistic scenarios and uses for many of the exercises and functions
- Course is regularly updated – I wouldn’t be surprised if there’s a 2022 update for the new version of Excel
- Great content length per lesson
Cons:
- This is a VERY long Udemy course. Most courses are between five to 10 hours, and this one is 18.
- The macros section was a tad hard to follow as that content ramped up fairly fast.
- There should be more comprehensive tests and quizzes at the end of each chapter. This would help validate the instructor’s concepts.
If you’re looking for a cheap, well-documented, good group of exercises in Excel, this is the Udemy course you should get. There’s a reason that over 200,000 users have used this course to sharpen their skills, and rate it at 4.6 and up.
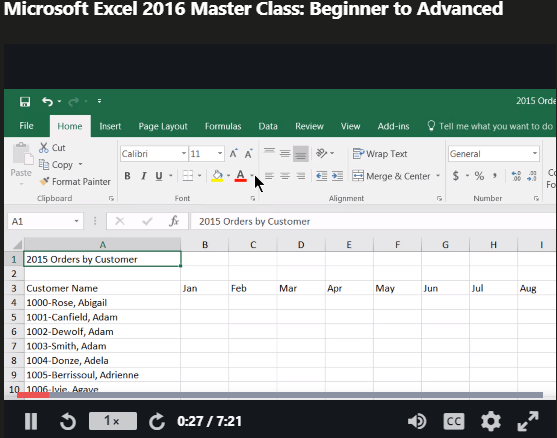
2. Top-rated Excel course: Review of Bruce Myron & Joe Parys’ ‘Microsoft Excel 2016 Master Class: Beginner to Advanced’
Course overview
If you’re looking for a fresh start and have very little or no experience with Excel, here is the class for you. Bruce Myron and Joe Parys’ eight-hour class is a compact, no frills Excel course designed to teach you the basics to advanced functionalities such as “What if” analysis, Pivot tables, and functions such as PMT(), SUM() and ERROR(). You will also learn how to traverse extremely large worksheets and troubleshoot issues. Bruce and Joe have taught well over 800,000 students by running training academies for all things digital related.
| Specs | Information |
| Overall Rating | 4.7 (12.5+ ratings) |
| Amount of Students | 58k+ registered |
| Length | 11 hours+ of videos |
| Downloaded Resources | 26 |
| Languages | English, Indonesian, Italian, Polish, Portuguese, Romanian Spanish. |
| Cost (USD) | $12.99 – $17.99 (when on sale) |
| Requirements / pre-requisites | Basic function skills with Excel is a nice to have. Should work with Excel versions 2016 and above unless spoken. |
| Excel Versions covered | 2010, 2013, 2016, 2019 and office 365. |
Some of Bruce’s and Joe’s course testimonials
The instructor was very knowledgeable, the course was very well done, and was more of an overview of just about every aspect of Excel. I have some experience with Excel but was amazed by all the time saving shortcuts, and parts of Excel I did not know existed. The instructor was very knowledgeable, the course was very well done, and was more of an overview of just about every aspect of Excel. I have some experience with Excel but was amazed by all the time saving shortcuts, and parts of Excel I did not know existed. My only complaint was I felt the instructor went way too fast at times and was very difficult to follow along, even at .5 speed, forcing me to rewind and pause, several times, and the reason I deducted 1/2 a star.
Marc Panella – February 2020 – 4.5/5 stars
Microsoft Excel 2016 Master Class: I found the class provides the correct structures to professionally use Excel 2016. Coverage given to data formatting through to advanced topics of table database capabilities and printing, makes the course a strong data management resource. The new features within Excel 2016 are impressive. My skills have definitely increased from the Master Class. The beginner to advanced format offers a great balance for learning and refreshing skills throughout the program.
Fleur Pepper – March 2020 – 5/5 stars
Really enjoyed this course. I thought I knew the “basics” but decided to start right from the beginning and it proved to be very beneficial as I found something in almost every lecture that I didn’t know. I enrolled to learn about pivot tables and manipulating large data sets and I am very pleased with the expansion of my skill set.
PJ Andrews – January 2019 – 5/5 stars
What you’ll learn
- How Excel works at a macro and micro level (tabs, tooltips, hotkeys, customizable ribbons)
- Keyboard shortcuts and how to work with the tool
- Column and row manipulation, as well as manipulating the data within the cells (formatting for dates, symbols, text)
- Basic formulas (Sum, VLOOKUP, Count etc.)
- How to format your spreadsheet for printing
- “What if” analysis and PMT() function
- Formatting and creation of tables, Pivot tables/charts, and how to lock your worksheet and protect your content
- Error-handling for cells
Overall recommendation and final remarks
At a high level, Bruce’s and Joe’s course material may seem very good and well-written. However, if you’re an intermediate or expert Excel user, a lot of the content may seem repetitive and easily accessible via a simple Google search. The first portions of the course outline basic Excel functionality and how to engage with a worksheet, with the latter portions being focused on more “expert” Excel things such as “What if” analysis or PMT() function, which are still fairly easy to work with.
Overall, in my opinion, this course is specifically built for users who have zero experience with Excel, and need/want to learn quickly.
Pros:
- Short, succinct content; compacted into less than eight hours
- Good resources and content, fairly well-structured
- Goes over the basic fundamentals of Excel and some more intermediate functionality
- Videos are short and bite-sized so that you don’t lose interest
- Heavy concentration on VLOOKUP
Cons:
- While the content is short and compact, it misses the mark on actually giving “advanced material”. No mention of higher level conditional functions, VBA, macros or PowerPivot.
- The narration can be a bit choppy when it comes to videos.
- You’ll be able to skip over a lot of the content if you already have some skill in Excel. This course seems more like an intro course to Excel that turns into an intermediate one later on.
- Only covers functionality in 2016 version of Excel (no mention of 2019).
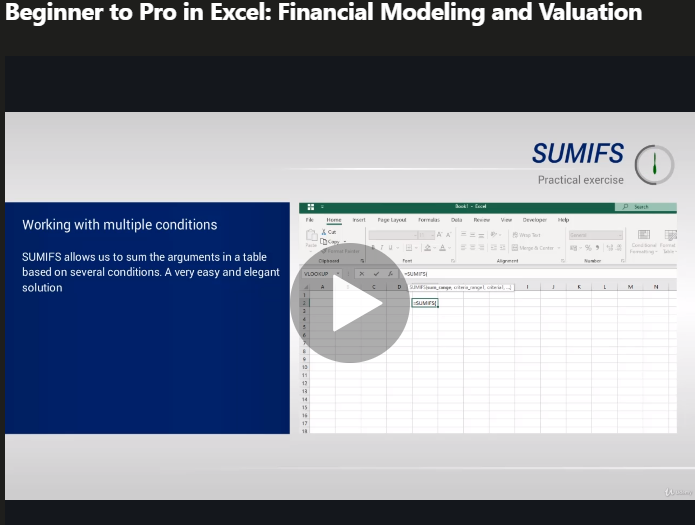
3.Best for financial modeling: ‘Beginner to Pro in Excel: Financial Modeling and Valuation’ by 365 Careers
Course overview
Even though most Excel users believe that Excel is primarily for financial modeling, there are many other purposes that it can satisfy outside of being a financial analysis tool. I’ve seen Excel used as a CMS, content hub, and to create mockups and wireframes for web/mobile design. This being said, most courses for Excel focus on a user who is agnostically looking to learn it. This course by 365 Careers focuses on Excel’s financial power user, and uses more of a finance standpoint to show you how to maximize your skill and return when using Excel.
| Specs | Information |
| Overall Rating | 4.7 (12.5+ ratings) |
| Amount of Students | 58k+ registered |
| Length | 11 hours+ of videos |
| Downloaded Resources | 26 |
| Languages | English, Indonesian, Italian, Polish, Portuguese, Romanian Spanish. |
| Cost (USD) | $12.99 – $17.99 (when on sale) |
| Requirements / pre-requisites | Basic function skills with Excel is a nice to have. Should work with Excel versions 2016 and above unless spoken. |
| Excel Versions covered | 2010, 2013, 2016, 2019 and office 365. |
Some of 365 Careers’ course testimonials
the course took me from the the basic important excel function that I overlooked but helpful to handle to handle volumes of tasks with easy and the course gave a solid background for me to understand and carry out financial modelling and evaluation tasks
Thembalami Ncube – December 2020 – 5/5 stars
I’m enjoying this course and all the learning steps along the way to help practice myself in excel. Ned is an amazing Instructor kudos to his teaching while sharing lots of tips. Formatting files I was needing to do while working on a project/spreadsheet my team wanted my input of ideas. Lastly learning to use VLOOK & HLOOKUP are quite challenging and with your help a bit easier to understand as I continued going over the steps of the slides to be sure I was getting it correctly while applying within my own spreadsheet. Taking the time of learning is the best way to fully understand and comprehend what you’re doing and you will also feel pleased to know you are more experienced after registering for Ned’s course. I highly recommend this class to everyone including those who may need a refresher’s course.
Tina Graham – September 2020 – 5/5 stars
I have completed the course. It took me more than couple of weeks to finish a 14 hour course. It contained so many information and hence had to note it down in the notebook, hence a 5 minute video took more than 15 minutes to finish. Thank you so much for this wonderful course. I feel a lot confident about working in excel now. I know many terms used in excel, shortcuts, and how to develop a financial model. THAT IS AMAZING to feel. Thank you so much. The lecture was clear and very easy to understand. I recommend this course to all.Show less
Aathira – August 2020 – 4.5/5 stars
What you’ll learn
- A high-level overview of many Microsoft Excel features
- General use of macros and overall automation building
- Basic to intermediate Excel functions (SUM() functions + variants, text functions (left, right, concatenate etc.))
- Lookup functions (VLOOKUP, HLOOKUP, index, match)
- Financial functions (round, choose, rank, ROI, IRR, NPV, FV)
- Pivot tables and error functions
- “What if” analysis (goal seek, scenario manager)
- Creation of a profit and losses (P&L) and FMCG from scratch
- Basic accounting spreadsheets, and calculating cash flows (WACC, deby modeling)
- Capital budgeting
- Creating a discount cash flow model from scratch
- Business analysis (trend, comparative, correlation, time series, and regression analysis)
Overall recommendation and final remarks
This course is intended for users who want financial skills in Excel. Despite working in technology and product, I completed my Bachelor’s degree in finance and have some intermediate exposure to financial statements, functions, P&L calculations, and other wonderful tools. This being said, the detail and precision that 365 Careers goes into when it comes to using these tools is fantastic. While the overall Excel training for broader Excel skills is short; it’s thorough, succinct, and purposeful. It provides the necessary skills and understanding to dive into a more comprehensive analysis of financial modeling in Excel. Personally, I think the business analysis and MA (mergers and acquisitions) sections of the course is a great business/stats analysis. If you’re a financial or business analyst, or are looking to evolve your skills to become one – this is definitely the Udemy Excel course for you.
Pros:
- Designed for Excel financial modeling and business analysis
- Three to four in-depth (1+ hour) case studies on how to perform financial models in Excel
- Quick, but thorough walkthrough of a number of Excel functions and Pivot tables
- Wickedly thorough case study on how to construct a discounted cash flow statement and P&L
- A few high-level theory slides on mergers and acquisitions, business analysis, and capital budgeting
- Good if you’re looking to evolve from a frontline manager to more strategy
Cons:
- This is a rather long tutorial, with over 13 hours of videos plus comprehensive case studies.
- This is not your average Excel tutorial – it specializes in the creation of Excel finance statements. Therefore, this isn’t recommended for beginners as 365 Careers will spend roughly two hours going over the intro content and then ramp right up into balance sheets and income statements.
- You really need to like finance to power through this course, as it’s quite finance-driven. This being said, the skills taught here will probably help you as you move toward a higher position in your career.
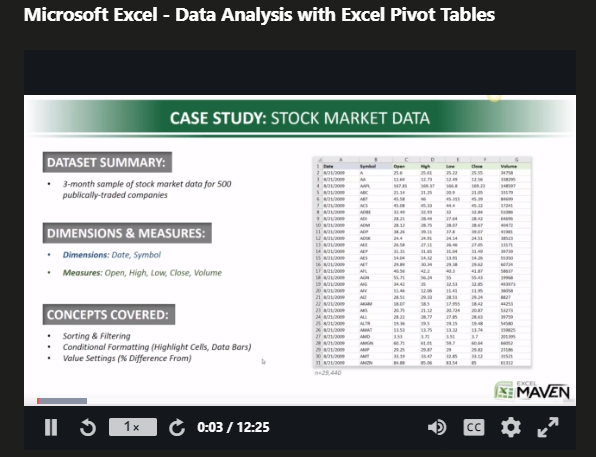
4. Best for Pivot tables and data analysis:’Microsoft Excel – Data Analysis
with Excel Pivot Tables’ by Maven Analytics and Chris Dutton
Course overview
A course specifically centered around Pivot tables. I’ve heard that many new Excel users are scared of Pivot tables and how complex they can be. However, this course is completely focused on being able to use Pivot tables in the real world. It’ll introduce a number of non-regular concepts, as well as a variety of quizzes, homework assignments, and 10 different case studies. Specifically tailored to students who want to learn Pivot tables more than anything else. If that’s you, this is the course for you!
| Specs | Information |
| Overall Rating | 4.7 (12.5+ ratings) |
| Amount of Students | 58k+ registered |
| Length | 11 hours+ of videos |
| Downloaded Resources | 26 |
| Languages | English, Indonesian, Italian, Polish, Portuguese, Romanian Spanish. |
| Cost (USD) | $12.99 – $17.99 (when on sale) |
| Requirements / pre-requisites | Basic function skills with Excel is a nice to have. Should work with Excel versions 2016 and above unless spoken. |
| Excel Versions covered | 2010, 2013, 2016, 2019 and office 365. |
Some of Maven Analytics’ and Chris Dutton’s course testimonials
I enjoyed the case studies even though some of them were hard nuts to crack especially when sorting and filtering or applying various concepts. It was slightly different from Excel on Mac so I had to figure out a few things on my own. However, working with the case studies and doing the homework gave me a better understanding of how dynamic data is, how useful Pivot tables are and as a data analyst, how critical thinking skills help you present data in an exceptional way. Definitely a course to revisit!! Thanks Mavin.Show less
Opisaziba Aranye-Okilo – August 2020 – 4/5 stars
Even though I have a lot of experience with pivot tables I still learned some valuable information that I will use going forward. The case studies were particularly valuable. The variety of data made it interesting and a good learning experience. The only improvement I can think of is that in my experience I have used pivot tables as a way to problem solve. So many times I have used a pivot table to get to a data set and then used those results to pivot the data a second time to get to my final data set. A case study of this nature would make this course even better for those who are starting to use pivot tables for the first time.Show less
Josh Aragon – October 2020 – 5/5 stars
When I signed up for an excel course, I had no idea it would cover pivot tables and things like this. I was more interested in the formulas aspect which is the next course. To be honest, I was lost most of this course. I probably need to go through it again just to get everything I missed. Since I am a beginner in this stuff, it was like drinking from a fire hose. I think a bit of computer savvy was expected and needed. But, I did learn a lot and at least now I can start to go through things I never knew existed before. At least now I know what all those buttons do when I get into excel!Show less
Tim Phillips – July 2020 – 3.5/5 stars
What you’ll learn
- Pivot tables 101: Creating, setting up, formatting, and configuring of Pivot tables.
- Filtering and segmenting with Pivot tables, and using slicers.
- Using Pivot table values and calculated fields.
- How to use Pivot charts and timelines, in-depth.
- A lot of Excel Pivot table case studies (2.5 hours worth)!
Overall recommendation and final remarks
This course is more specific to those who want to learn Pivot tables. Therefore, you may need an intermediate set of skills in Excel to actually be able to engage with and grasp the content. In looking at user comments, many will flag that this course can be somewhat complex if they had zero experience in Excel.
Overall, this course is designed for those who want more Pivot table action and to master Pivot tables, while not necessarily being all that Excel-focused (in the general sense of function usage, VBA and macros). However, the case studies at the end are amazing!
Pros:
- Fairly short, but still with some pretty complex content
- Super in-depth analysis of Pivot tables and how they work (best I’ve ever seen)
- 2.5 hours of case studies using different Excel Pivot tables
- Lots of insight into business analysis (looking past the data)
Cons:
- Not necessarily a “full-stack” Excel course. More focused on Pivot tables.
- If you’re a Mac user, this course might be difficult to follow because Excel for Mac and PC run differently.
- Some of the content is pretty basic, and could be considered boring to those who’ve already worked with Pivot tables.
Check this course out on Udemy!
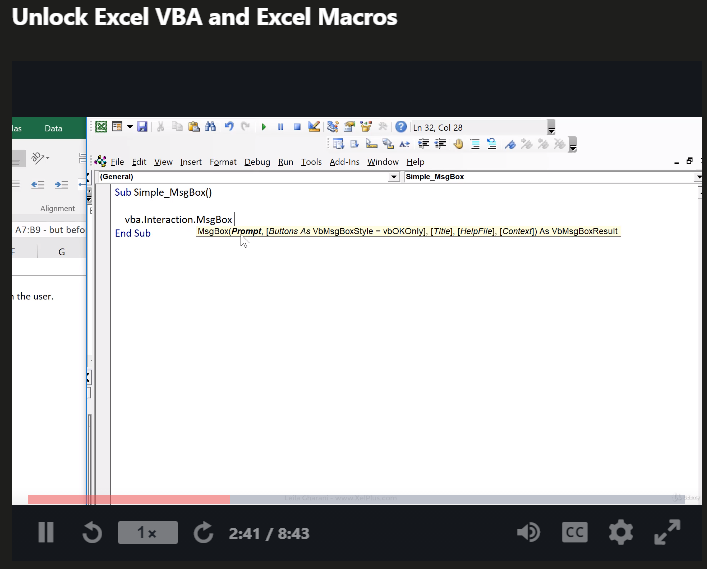
5. Best for VBA and Macros: ‘Unlock Excel VBA and Excel Macros’ by Leila Gharani
Course overview
A very long, but detailed course about VBA and Excel macros. It breaks down the overall fundamentals of Excel VBA and macros, and you will learn over 50+ macros to help automate your workflow and process in Excel. You’ll also learn how to interact with the more basic functions and tools (Pivot tables, cell references and export import functions). This course will begin with the basics of VBA (loops, data-types, macro recorder etc.) to help cement the rest of the content.
| Specs | Information |
| Overall Rating | 4.7 (12.5+ ratings) |
| Amount of Students | 58k+ registered |
| Length | 11 hours+ of videos |
| Downloaded Resources | 26 |
| Languages | English, Indonesian, Italian, Polish, Portuguese, Romanian Spanish. |
| Cost (USD) | $12.99 – $17.99 (when on sale) |
| Requirements / pre-requisites | Basic function skills with Excel is a nice to have. Should work with Excel versions 2016 and above unless spoken. |
| Excel Versions covered | 2010, 2013, 2016, 2019 and office 365. |
Some of Leila Gharani’s course testimonials
Thank you for the course Leila. It was very well made. I made tremendous progress in my excel and VBA skills that will be useful for sure for the rest of my career. It will take some more time and practice to digest all this content because there were a lot of information. I really liked the link with other applications such as Word or Powerpoint as well. The examples were very well chosen and this information is hard to find on the web.
Cédric Thibaut de Maisières – January 2021 – 5/5 stars
I am implementing the lessons of the course for my work as a Data Analyst and I can truly say it exceeds expectations. Not only you will know everything you need about Excel VBA, but the practical workbooks developed through the course really help getting you started on your own projects. I would without a doubt, recommend this course.
Marco Fiandrino – December 2020 – 5/5 stars
Good so far. If you watch the videos enough you will really grasp the concepts. At first, it sounds really intimidating, but later it all makes sense. I believe you become familiar with code and how to read the code so it makes sense to you. At this point, in the course I have practiced these macros in real life, but I am learning a lot right now. Hopefully, when this course has finished, I will be decent at working with VBA.
Leonard Gonzales – September 2020 – 5/5 stars
What you’ll learn
- Recording macros
- How to work with VBA and macros and their differences
- VBA syntax, how to handle properties, methods, VB keyboard shortcuts, and libraries
- How to reference data from worksheets using VBA (at least three to four methods)
- Working with variables and data-types/objects
- Loops (IF, else, elseif) and goto statements
- Built-in functions like inputbox
- Debugging and error-handling, and passing arguments for sub procedures (Ref, Val)
- Working with Arrays
- Interacting with workbook and worksheets with events
- Using VBA to interact with Word, Powerpoint, Access
- Userforms and ActiveX controls
- User-defined functions
- Manipulating charts with VBA
Overall recommendation and final remarks
Overall, this is an in-depth, quite advanced course for VBA and macros. Leila’s elegance, poise, and methodical approach for this course will help you understand VBA and macros at an intermediate level if you’re able to absorb everything said by the end of it. Some of the comments flag the course being too advanced and rightly so. This course is specifically designed for those who already are masters or power users of Excel. Coding experience (I have some moderate skill with Python and web development) also come in handy because you will be exposed to user-defined objects, variables, loops and conditional statements. Much of the content is real-time related and up to date. If you’re a data analyst or in financial markets, this is the course for you if you want to learn about macros and VBA on Udemy.
Pros:
- Really good examples and exercises for VBA and macros and case studies
- Good walkthrough and intro to VBA and macros
- Great focus on real world applications and automation
- Well-structured, with a good lead in
Cons:
- This is a A LOT of content, and it’s a long course – buckle up!
- Could have potentially been broken into two or three separate courses
- Assistants are a little difficult to work with
- Not for Excel beginners
Check out this course on Udemy!
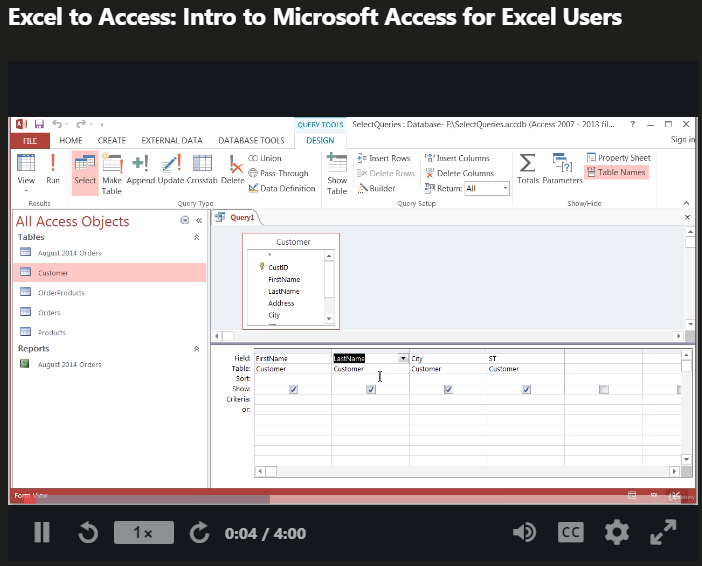
6. Best Excel and Access course: ‘Excel to Access: Intro to Microsoft Access for Excel Users’ by Bruce Myron
Course overview
Another specialty Excel course that focuses specifically on integrations of Excel with Microsoft Access. Overall, Access is a great tool for database (DB) administration and can easily help small and medium businesses scale up to an appropriate level. This course will walk you through the fundamentals of Excel integration with Microsoft Access, and a number of nuisances to using Access.
| Specs | Information |
| Overall Rating | 4.7 (12.5+ ratings) |
| Amount of Students | 58k+ registered |
| Length | 11 hours+ of videos |
| Downloaded Resources | 26 |
| Languages | English, Indonesian, Italian, Polish, Portuguese, Romanian Spanish. |
| Cost (USD) | $12.99 – $17.99 (when on sale) |
| Requirements / pre-requisites | Basic function skills with Excel is a nice to have. Should work with Excel versions 2016 and above unless spoken. |
| Excel Versions covered | 2010, 2013, 2016, 2019 and office 365. |
Some of Bruce Myron’s course testimonials
Well, what can I say. This course has been interesting and very well presented. I have all sorts of ideas buzzing around in my head as to what I can do in Access and break that old problem of developing a complex Excel spreadsheet for others to use (and inevitably break). I love the way that it removes the possibility of breaking the integrity of structure (no way we can prevent people from entering bad data however so that is the next challenge). Thankyou, I have enjoyed myself immensely.
Roger Truslove – March 2020 – 5/5 stars
I thought I had a decent handle on several aspects of Access from an in-person course years ago but the way Bruce explains the material and breaks down his lessons really gave me a whole new level of understanding for how to build out Forms and Reports, while tying in Queries and Macros. I want to go through more of his courses now, especially VBA. Thank you for putting this course together, Bruce!
Joshua Schirner – February 2020 – 5/5 stars
I have many years of experience with Access but it is antiquated. I also used to code so VB was in my wheelhouse. Now I am trying to move our org out of Excel into something that meets some higher standards of data integrity. Garbage in, garbage out. I forget how foreign keys work; forget how to merge tables together, and want to build in some controls so that other users can query the data too. So far, all good. I’ve picked up some good tips.
Barbara Anderson – January 2021 – 4/5 stars
What you’ll learn
- Table objects, report objects, query objects, and how to run a SELECT query
- Reports in Access
- Unique values, TOP and total queries
- ACTION queries
- How to migrate data from Excel to Access
- FORM objects and how to create a customer and orders form
- How to automate the opening and closing of the database
- How to create an invoice easily
Overall recommendation and final remarks
Overall, this is a good course because it helps bridge the gap between Excel and Access, while giving you a preliminary look and feel into Access tooling. Access ultimately feels and acts like an SQL server (at a basic level), so if you know how to run CRUD operations, query, and the basics of DB – consider doing this course. Personally, I don’t find Access all that useful since it’s not hard to spin-up an instance of MYSQL, noSQL or bigQuery to facilitate all of your data storage needs.
If you’re interested, I have an article specifically on the best SQL courses on Udemy. Give it a ready if you want to learn more DB stuff!
Pros:
- Good course, lots of examples and information on Access
- Shows the relationship between Excel and Access, and the pros and cons of each
- Great length for a Udemy course
Cons:
- Access itself is fairly basic; could a modern DB service remedy all of your issues?
- More practical, real-life exercises would have been nice
Check this course out on Udemy Learning!
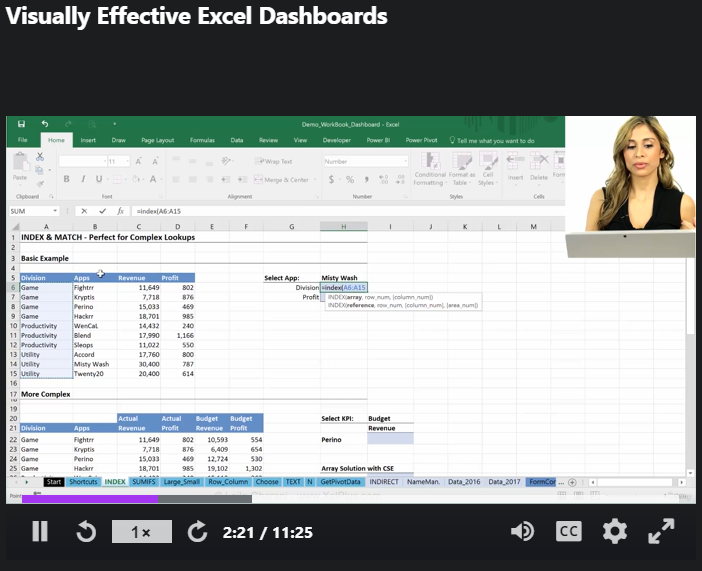
7. Best data visualization excel training – Visually Effective Excel Dashboards by Leila Gharani
Course overview
Another great course by Leila, but specifically for excel dashboards that are usable and fluid for users. You’ll be able to build dashboards for management and reporting which is faster than doing excel from scratch. You don’t need VBA and will go over all of the excel formulas that you need (IFs, ROW, CHOOSE, INDEX + MATCH) and the all important GETPIVOTDATA function).
At the end, you’ll build a KPI dashboard from scratch with scrolling and bars.
| Specs | Information |
| Overall Rating | 4.7 (12.5+ ratings) |
| Amount of Students | 58k+ registered |
| Length | 11 hours+ of videos |
| Downloaded Resources | 26 |
| Languages | English, Indonesian, Italian, Polish, Portuguese, Romanian Spanish. |
| Cost (USD) | $12.99 – $17.99 (when on sale) |
| Requirements / pre-requisites | Basic function skills with Excel is a nice to have. Should work with Excel versions 2016 and above unless spoken. |
| Excel Versions covered | 2010, 2013, 2016, 2019 and office 365. |
Some of Leila’s Course Testimonials
I have been using advanced excel formulas for a while, and I thought I knew a lot until I took this course. This course has taught me how I can use same formulas I have been using in more creative and unique ways, and how I can solve more complex business problems with the same Excel functions. Dynamics dashboard preparation is amazing. You should definitely take this course even if you already know excel. Trust me, there are things you will still learn. And if you are new, then you don’t need to look anywhere else. Just dive into this course and you will come out on the other side as an impressive Excel wizard.
Shaikh Jawward – 5/5 Stars – June 2021
Excellent course by an EXCEPTIONAL professor / professional. Very detailed. I’m an experienced computer programmer (Database – ETL – and recently Business Intelligence Developer) with over 10 years of experience. I learned a lot here!! I’m also taking the Excel VBA course which I love even more. Leila Gharani is simply one of the best Excel professors you’ll find. Worldclass!
Angel M. Benitez – 5/5 Stars – February 2021
Fantastic course. I am using XCL on a daily basis and I really feel that this course has significantly improved my skills in basic sheet architecture, solving complex problems in an easy way and – of course – building dashboards. Using the taught skills, I have already build an own dashboard and it turned out great!
Markus Latschbacher – 5/5 Stars – March 2021
What you’ll learn!
- How to source your data from Access, Add-ins, Text, CSV
- Functions (Index-match, IFs, Large / Small, CHOOSE, GETPIVOTDATA, ROW) and flexible ranges.
- Form Controls (Check box, Spin Button, Option Button, List Box, Scroll Bar)
- KPI dashboards with (Conditional coloring, Scrolling, Combo boxes) and relevant exercises.
Overall considerations for Leila’s dashboard course
Overall, this is a great course because a number of the things that Leila goes over is great for learning advanced excel skills. Most of the course is a walkthrough, talk through on how to build a KPI dashboard from scratch. As I audited the course, I felt like it was extremely long for a topic that is be revolutionized with tools like Domo, Tableau and Google sheets. That being said, it’s a great excel course and definitely worth your money!
Check out Leila’s course on Udemy!
Final remarks on the best 7 Microsoft Excel courses on Udemy
The above list is not meant to be exhaustive, and may not be perfect. However, I tried my best, as an Excel user to consolidate, add together by ratings, and audit the top six Excel courses in specific categories. There may be more Excel courses that you can think of that are amazing. If you want me to audit or change this list, leave a comment below with the Udemy course you have in mind.
Review of “Kyle Pew’s best overall Excel course”
An audit and walkthrough of this course
At first glance, this is a thorough course. Kyle (the course instructor), walks through every aspect of the Excel as a general program. From starting Excel, to saving files and all the way to Visual Basic for Applications (VBA). Here’s how I would break down the mind-blowing 35+ sections of this course.
But first: My skill level taking this course for the first time:
I would consider myself an intermediate Excel user (I have my Excel 2013 specialist certification), so I’m comfortable with more advanced functions (VLookup, Match + Index), What if analysis, Pivots + Pivot Charts, Conditionals (AND, OR, ELSE, IF) and many other things. Therefore, I was able to breeze through many sections of this course, but did pick up a few solid skills and learn things I didn’t necessarily know along the way.
Requirements for this course are as follows: You need a running Excel software installed on your computer. It can be a MacOS version, or normal Windows version from 2007 to 2019. However, if you’re using a 2007 or 2010 version of Excel, you may miss out on certain functionalities released in the future years.
I also think it helps if you’ve used Excel before and have a level of object-orientated coding. Knowing how SQL and other DB languages work can be a benefit as well.
Overall, this course took me roughly 20 hours to get through!
I tackle this comprehensive audit by going over the general clusters of sections, with a quick blurb and some screenshots for each section. Not all portions of Kyle’s course are important but I hope by the end of this course you will have a good bearing on whether you should purchase it or not.
Unit #1: Sections 1 to 11 or Excel 101
Honestly, most of the stuff in these sections are pretty intuitive. If you have any experience with Excel, you will BREEZE through this content like I did. It took me roughly 2 to 3 hours to get through sections 1 through 12. Kyle will call this Excel 101, which is very true.
If you have no experience with Excel, do these sections. If you want to brush up on some nuisances or shortcuts, consider cherry picking lessons or sections that appeal to you.
Sections 1 to 3: The basics
This section covers the VERY basics, from how to save and shortcuts to how to enter values in Excel. Kyle will go over how to build a basic matrix (monthly budget) and working with references, absolute values and basic formulas. I did appreciate his in-depth dive into date values and how to configure custom date formats in the formatted cells. It can be confusing for Excel users, but comes pretty handy.
One major lesson that I think everyone should pay attention to is Lesson 18 (relative versus absolute cell references). As relative and absolute formulas are key for referencing (lookups, indexing, etc.), make sure you have a good grasp of what these are. As an intermediate Excel user taking this course, I didn’t know about the “evaluate formula” window, which can show you the order of operations.
Section 4: Basic Excel functions
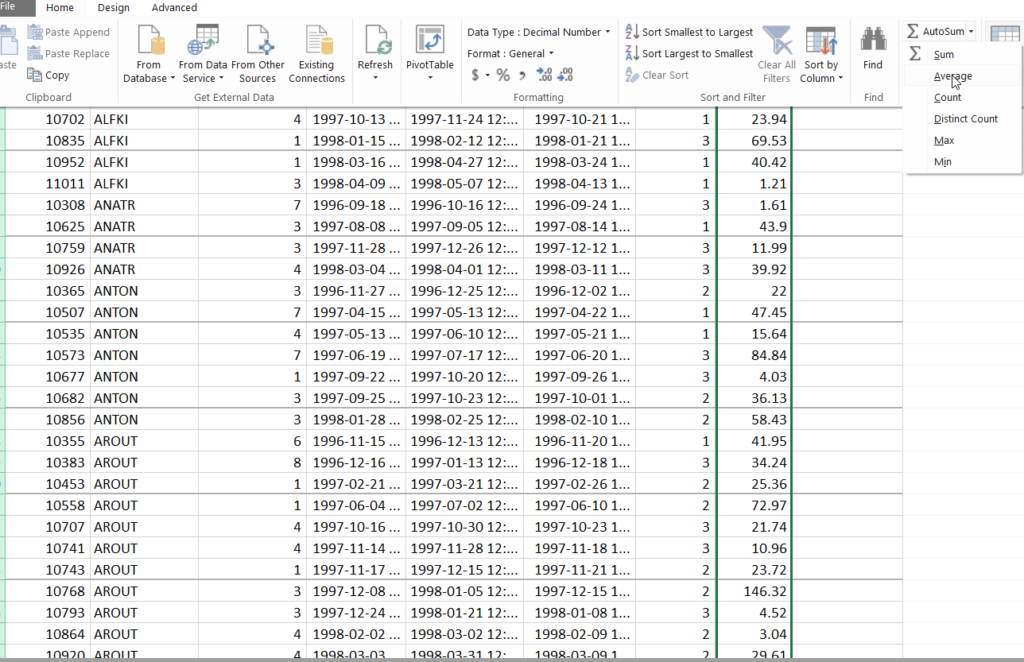
If you’re an Excel newbie, this section is very important. In fact, this and the following sections (sections 5-9) are based off the basic excel functions (Sum(), MIN(), MAX(), Average(), COUNT(), and going through the basic formula toolbar.
What’s nice is that Kyle will walk through the basic functions of the toolbar, how to use functions within the cells themselves, and how to search for specific functions in categories. Section 4 finishes up with auto-summing and auto-filling and how they work in Excel.
Sections 5 to 7: Data, hotkeys, shapes, images, and more
These sections are more specific to outlining data, copy data, and overall manipulation of rows and columns (hiding, width of cells). One thing that section five does quickly is cover hotkeys to add and subtract rows and columns (“Ctrl ++” or “Ctrl + =”), which I didn’t know before.
Overall, most of section five is stuff that a regular Excel user should already know. Section six focuses more on formatting of cells; more specifically:
- Colour
- Alignment
- Data within the cell (%, decimal points)
- Customized style formatting
- Borders
- Conditional formatting
This section brought out my actual FAVOURITE tool in all Excel, which is the format painter tool. The reason this tool is amazing is that it allows you to be able to copy formatting from any cell in the workbook onto any other cell.
Section 7 concentrates mostly on shapes and inserting images – nothing too difficult. You can really manipulate and format Excel shapes, although I haven’t really seen a lot of use for this over the last 10 years of using Excel.
Sections 8 to 10: Charts
Charts, formatting charts, and copying and pasting charts, as well how to manipulate elements on the chart and attributes like labels.
Section 8 finishes up with how to work with pie charts and formatting within the chart when it comes to colours, designs, and overall styles. Section 9 focuses on printing and how to format content for printing in your print setup options.
You’ll go through specific settings like “fit sheet on one page”, “fit all columns on one page”, or “custom scaling” options. A large bit of this section will focus on the latter option, general layouts, as well as header and footer content. One thing I did take away from this section is the page layout view, where you can adjust your pages easily.
Section 10 focuses on templates, and the concepts of Excel templates. To sum up this section, you have the capability to just save templates in your menu, and then you can re-use and recycle hundreds of templates. The section rounds out with creation of custom templates.
Unit #2: Sections 12 to 20 or Excel 102
This unit has a lot of things I’ve never heard of before, but most of the content is easy to follow as Kyle does a great job at explaining anything that could be deemed intermediate.
You’ll end up tackling things like D-functions, pivot tables, handling lists, power pivot, and manipulating large worksheets (freeze pane, printing large worksheets, and much more). I recommend paying attention to this unit thoroughly and giving it more of a try than the previous one.
Some major portions of what Kyle covers appears on the ‘Excel MO-201: Microsoft Excel Expert’ exam, specifically the charts, pivot tables, and power pivot.
Sections 13 to 14: Lists, sorts, and DSUM
These sections are more of a breakdown of list structures, uploading large data files, multiple records, and worksheets. Kyle will break down how to interact with lists (I’ll call it large tables), multi-sorting and single sorting (using the toolbar and Sort widget), and building custom sorts.

One thing that I didn’t know that Kyle brought up is that you can sort 64 different columns or rows (levels) in Excel. That’s insane! Also, you’ll get to see how to format a list as a table (with the design tab), and finish off with formatting conditionals and – one of my favorite tools – removing duplicates.
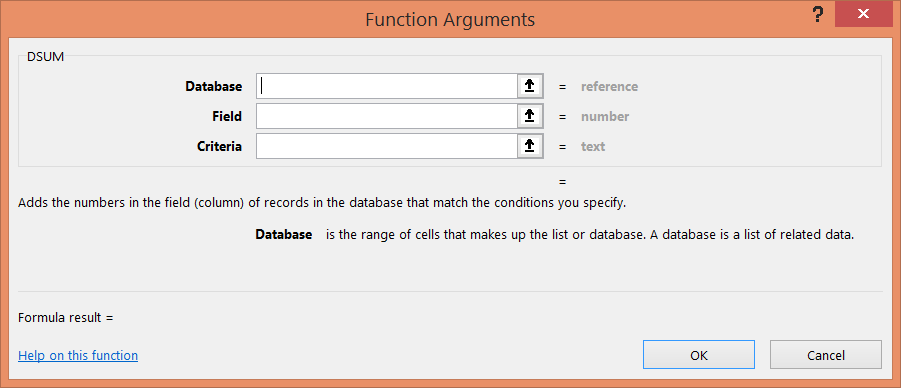
Section 14 is particularly interesting as this is where Kyle brings up DSUM. As stated before, I do have experience using many of the functions and features of Excel. However, DSUM was new to me, and Kyle explains how it works throughout most of this section.
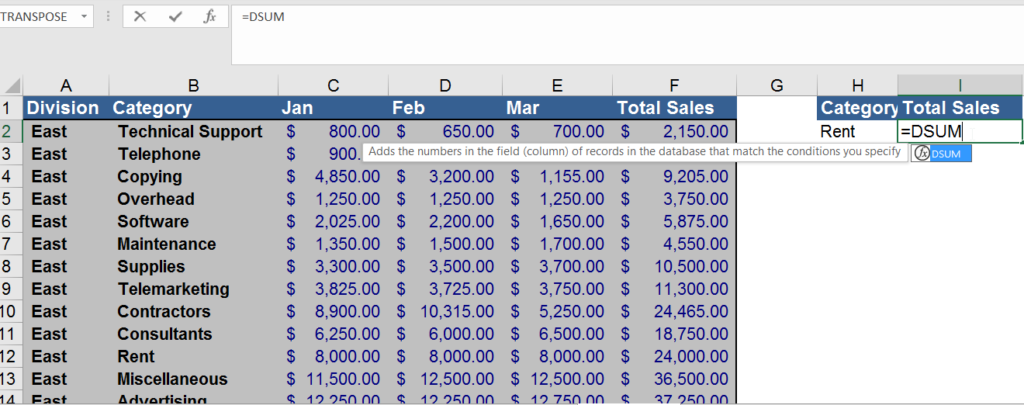
DSUM is basically an ‘if’ statement, combined with a VLookup based off its criteria. A very useful tool indeed!
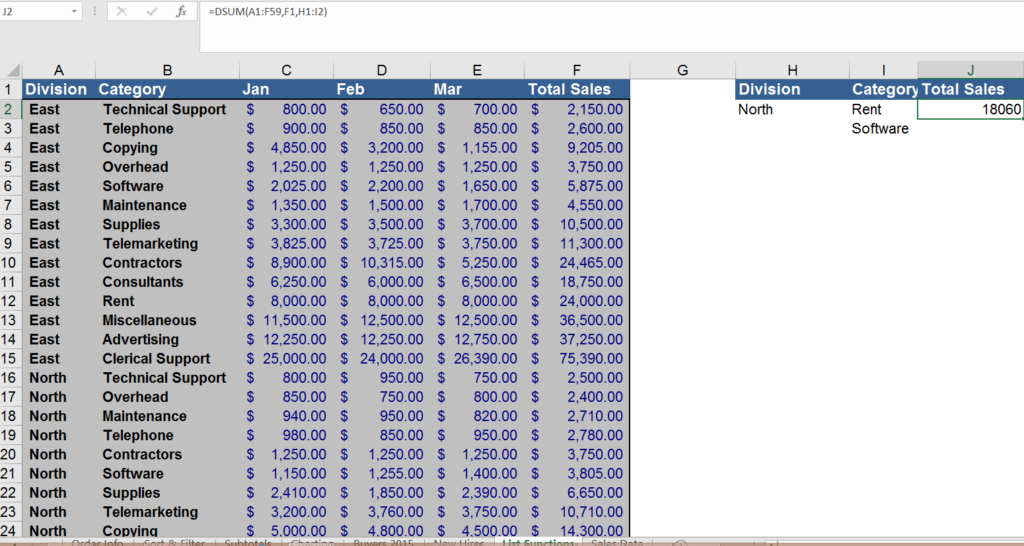
Note, just like any lookup – these are case sensitive. You can also use conditionals like (OR, AND) in the criteria portion by adding more information into the specific column.
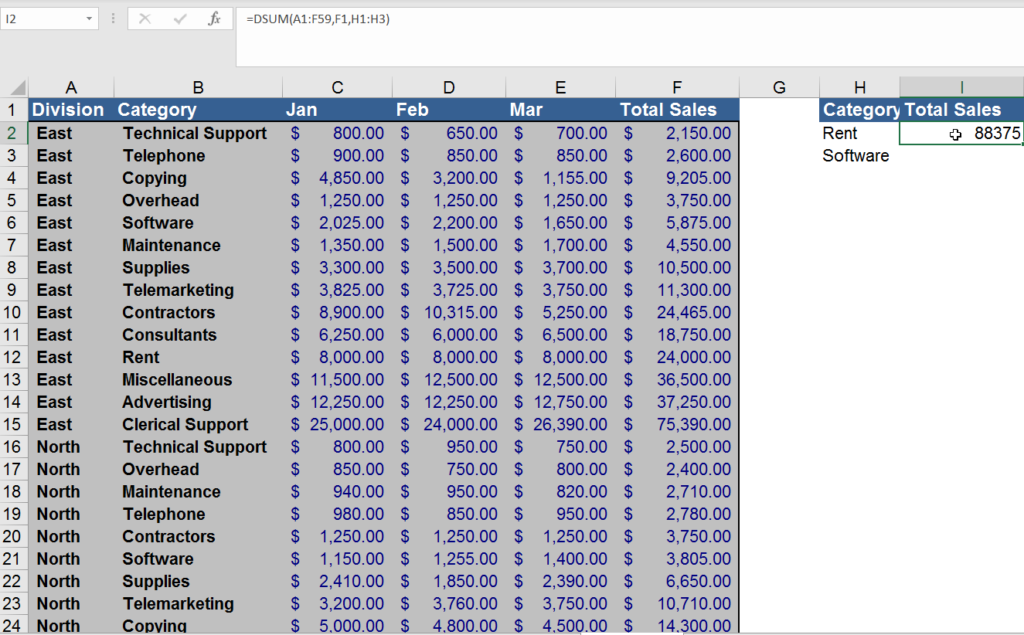
You can also use DAVERAGE() and DCOUNT() the exact same way, with the calculations being different. The functions differ with the overall technique to use AND / OR being the same as DSUM().
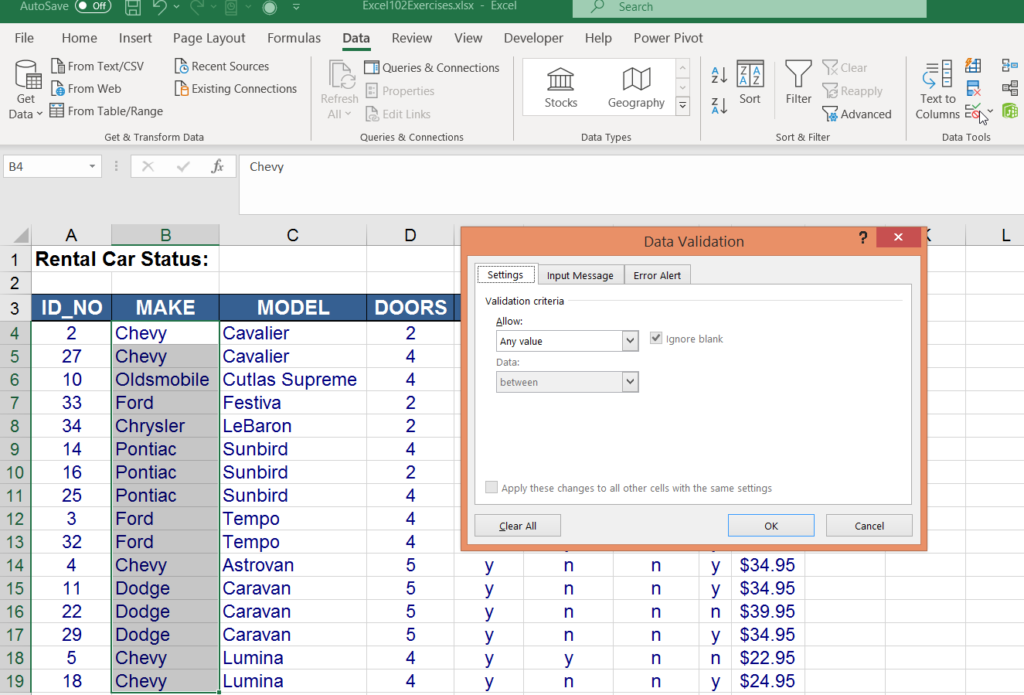
Section 15: How to use data validation
This section breaks down how to use data validation. Kyle really tackles the content properly and walks you through how to add data validation within the DATA tab in Excel. He also shows you how to customize where you want it (see below screenshot) to be validated within your spreadsheet, and the type of error message you want.
Although I love this feature in Excel, I’ve never had to use it. However, I know a lot of financiers that use this feature to protect the validity of their Excel sheets.
Section 16: Importing data
This important chapter is about importing data into Microsoft Excel. I do this probably everyday. Kyle gives you an appreciation for the .txt file and delimiters 😊. He also goes through importing data from a text file and Microsoft Access. Due to the change in the way you import data in post-Excel 2013, Kyle goes through both executions post- and pre-Excel 2013 importing methods.
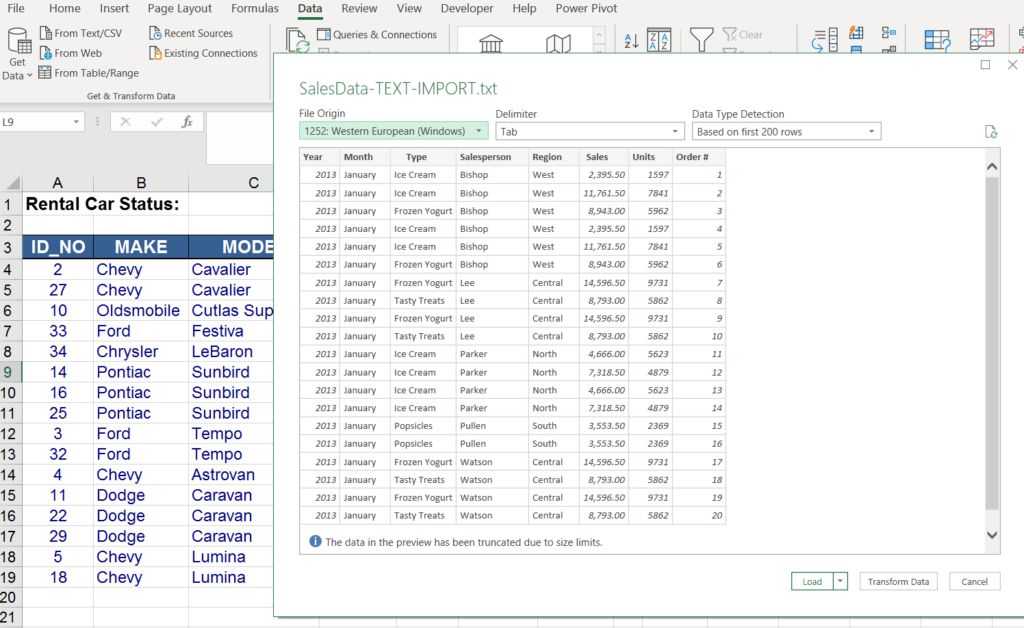
He also explains delimiters (commas, tabs, colons etc.) and quantifiers. All great stuff to know for Excel. If you’re an Access user (I’m not), Kyle has a quick walkthrough, talk-through on how to import DBs from Microsoft Access. Access works very similar to SQL and you can just follow the prompts when trying to import the DB.
To round out the section, Kyle exports data into a .txt file – which may seem counterintuitive but .txt files are basic and are system agnostic. It’s as simple as saving your worksheet as a .txt file and then opening it in Notepad, WordPad, or basic text editor (for you Mac users 😊). Who knew it would be so easy!
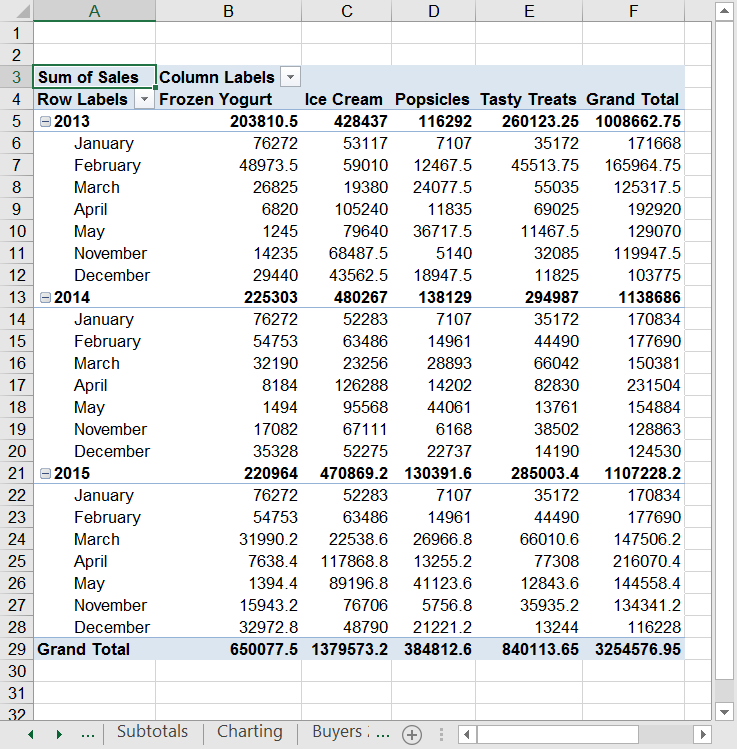
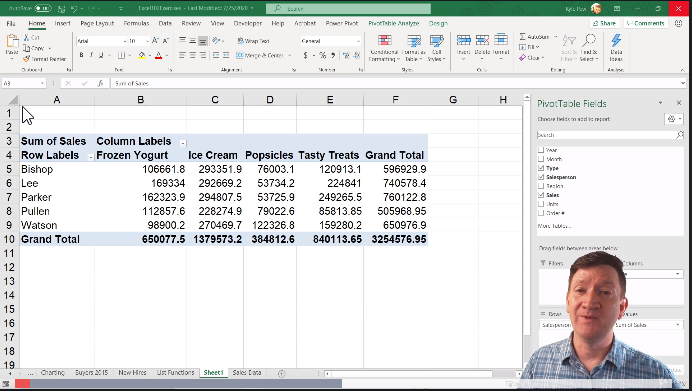
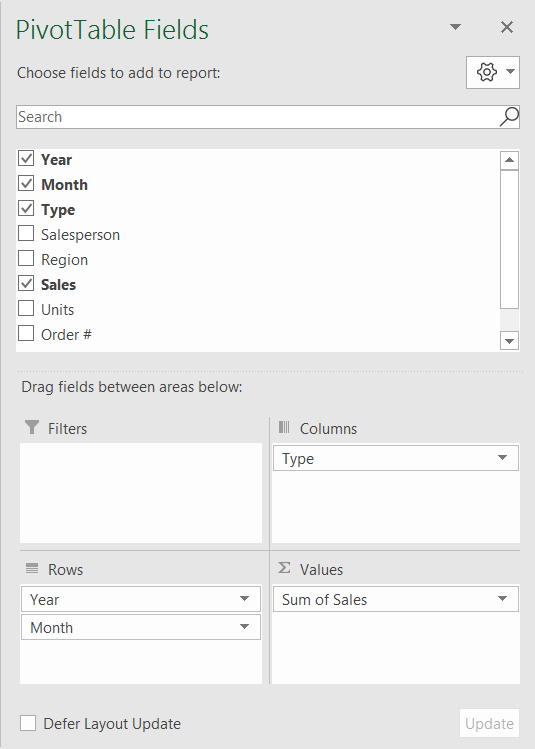
Section 17: Pivot tables and charts
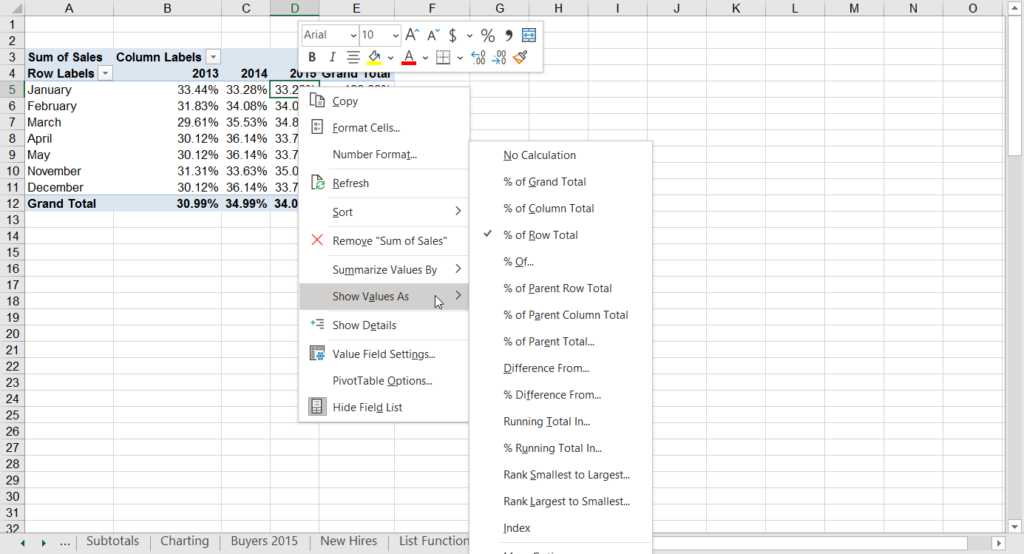
This is a big section on pivot tables, as they are one of the most used tools in Excel. The course walks you through how to create a pivot table from scratch, custom calculations, filtering, grouping, pivot charts, and slicers.
Setting up a pivot table is super easy. All you need to do is select the data you want to pivot it on (make sure it has labels and de-duplicated data), then subsequently create your pivot table using the ‘insert’ tab. This is all straightforward, and I must have built thousands of pivot tables in my career to date.
The section subsequently drills further down into the pivot tables by showing you how to group in pivot tables, which is also a favourite of mine (as this allows you to better organize your data). It continues into formatting pivot table data, but this should be fairly intuitive at this point.

The next portion in pivot tables is pivot charts, which is also a wonderful tool.
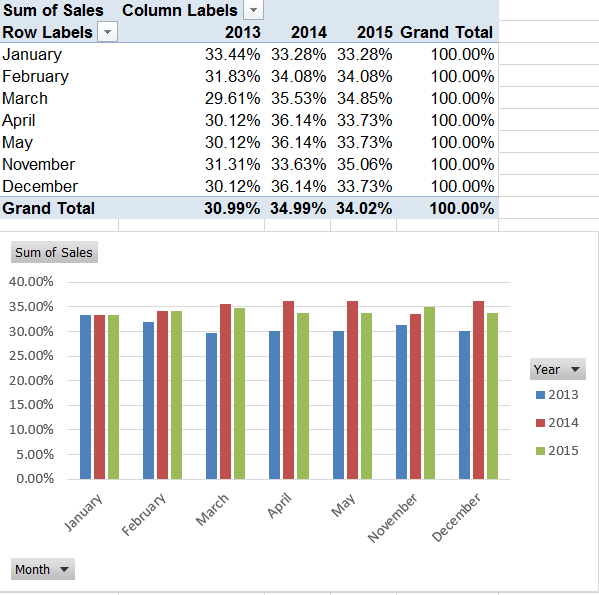
Kyle shows how easy it is to update the pivot chart and the table combined. Just like normal graphs, you can easily style and update the content within the pivot chart. Pivot charts are perfect for setting up dashboards!
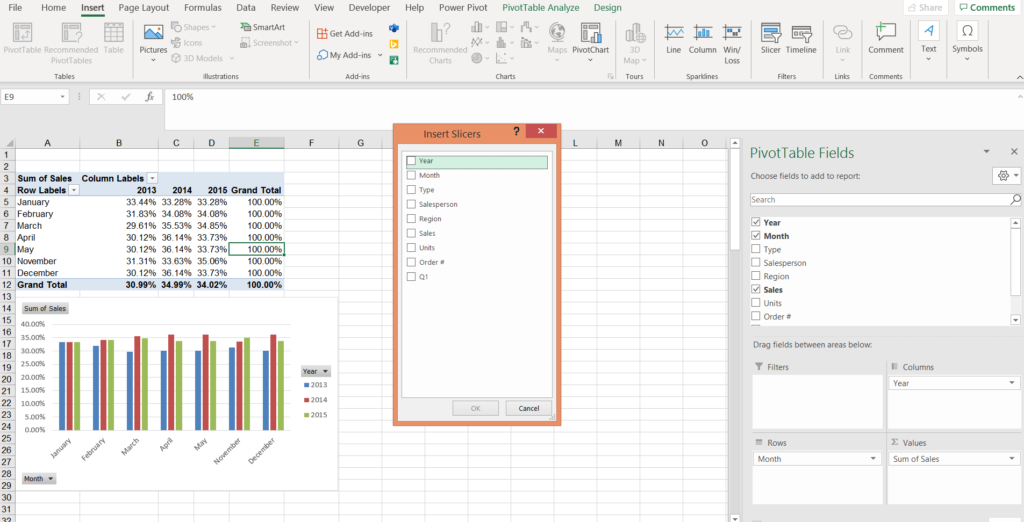
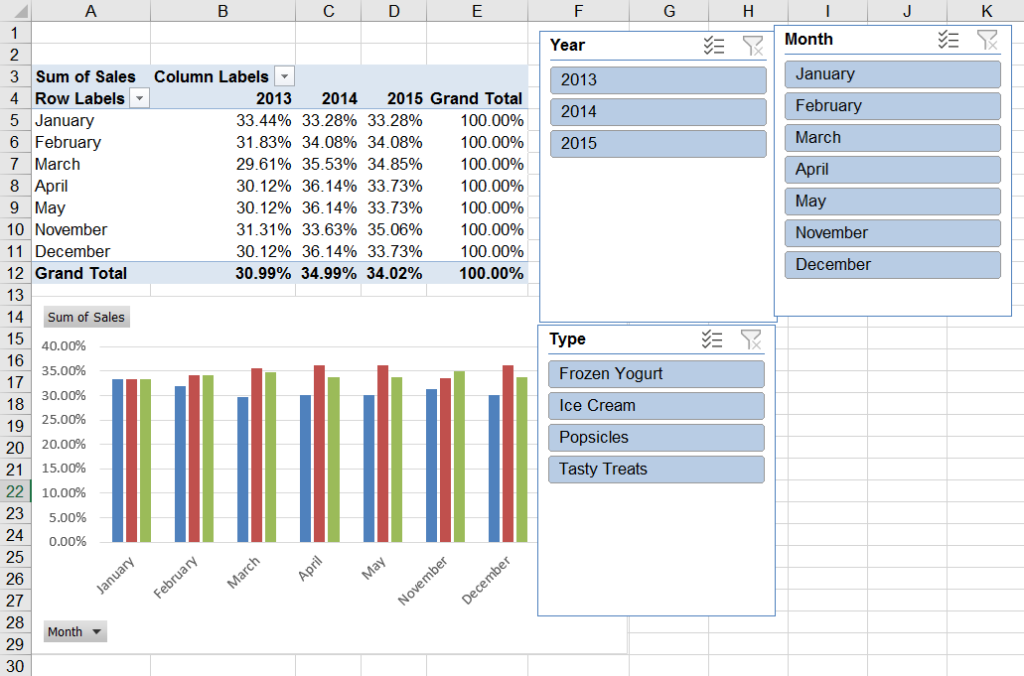
Last but not least in this large section is filtering and slicer tools. Filtering is pretty simple and is usually added into the pivot chart itself.
Section 18: Power Pivot
Something I’ve never dabbled in before in Excel is Power Pivot, so it was refreshing to hear and do something new. Kyle begins by explaining that Power Pivot was introduced by Microsoft in version 2010 and later.
You then learn that, essentially, one of the most powerful things about Power Pivot is that you can link two worksheets together and build a report from both, as long as they have a commonality between them.
From my developer-ish brain, this reminds me of a JOIN in SQL.
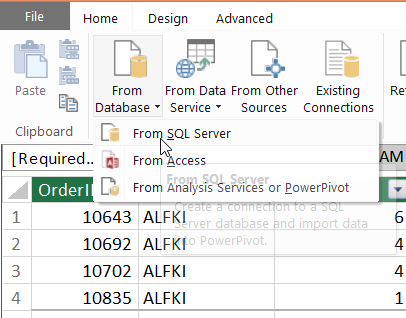
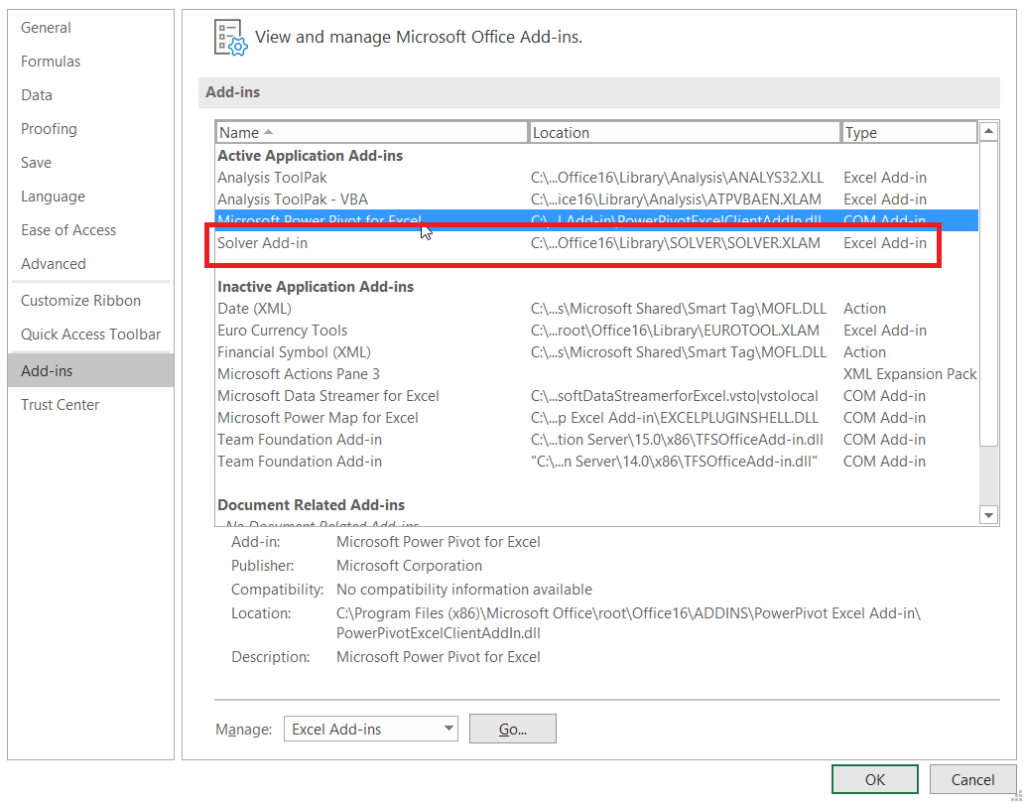
You may have to enable Power Pivot on your Excel. You can do so by navigating to “options” (under File), and then selecting ‘Add-ins’.
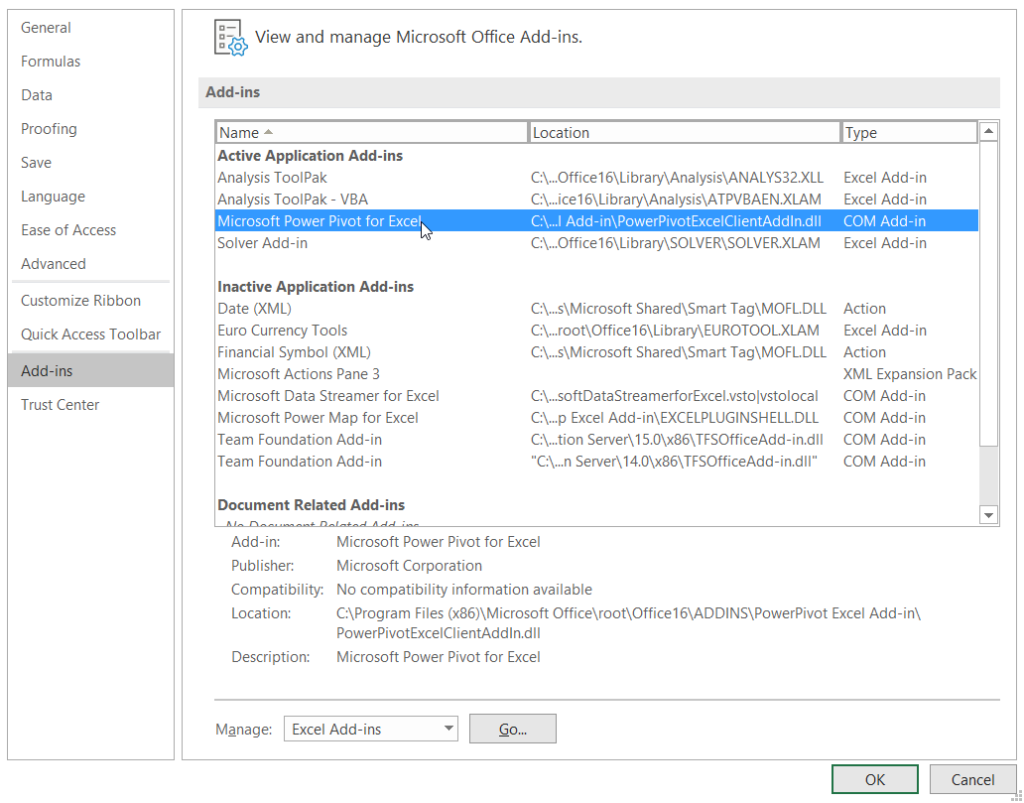
From there, you should be able to add-on Power Pivot to your Excel. However, if you have Excel on a Mac, or Excel that’s older than 2010 – this may not be available to you. On my 2019 Excel version – I already had Power Pivot enabled on my toolbar.
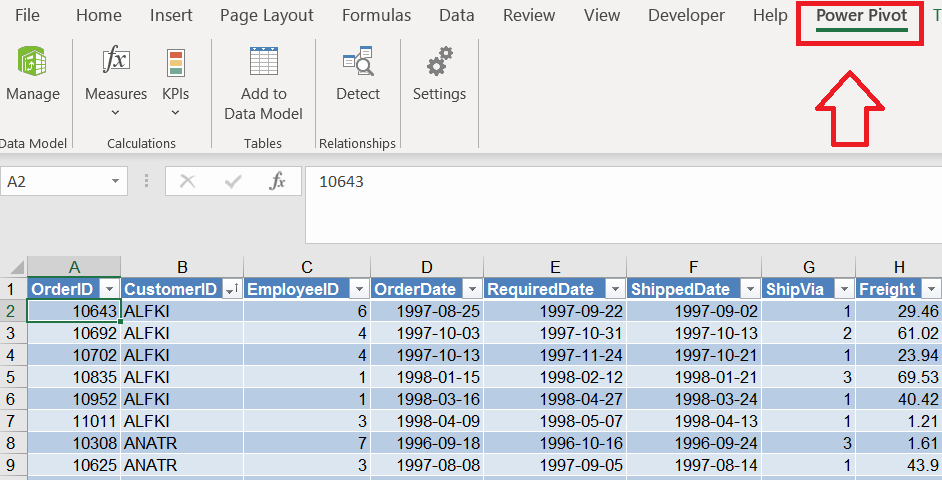
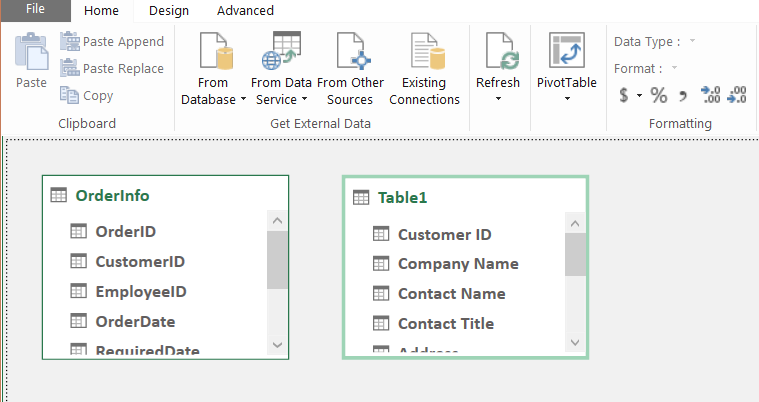
Your first step to start Power Pivot is to ‘Add to data model’. The data model is based off your Excel data, so if you make changes in your original worksheets, your data model will consequently change.
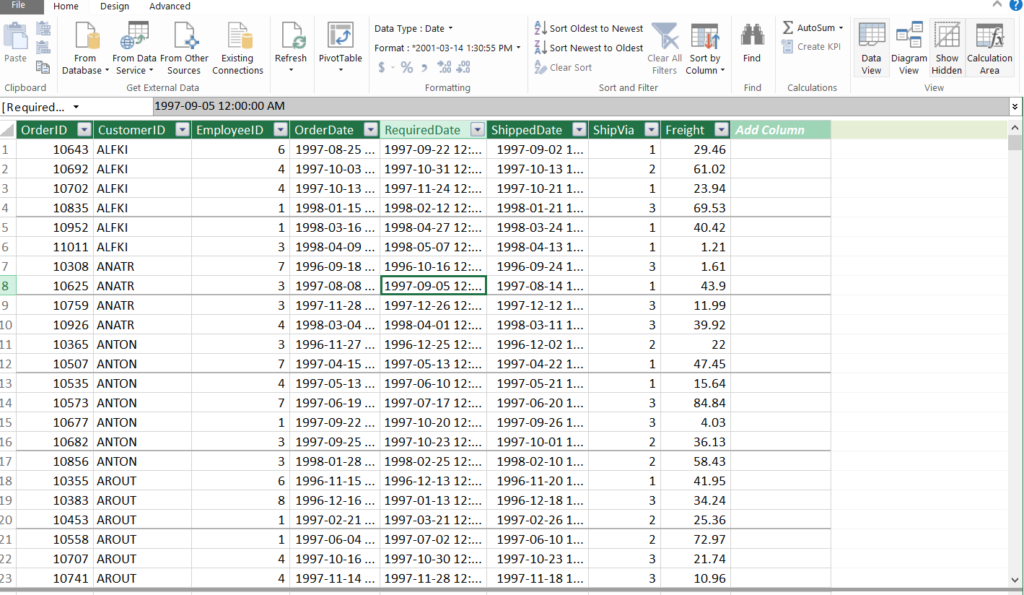
You’ll want to add all of the worksheets you want to your data model before you start relating worksheets. You can also connect SQL and Access Databases.
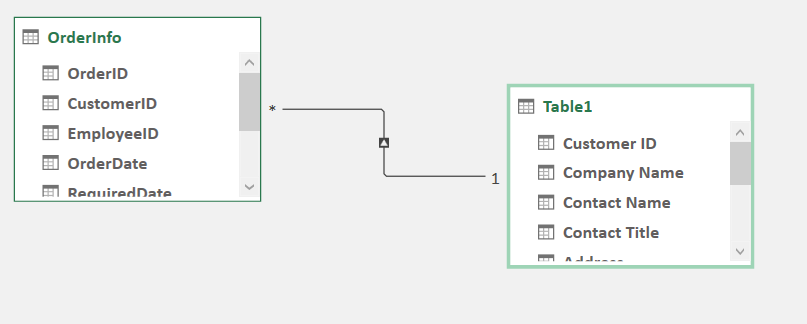
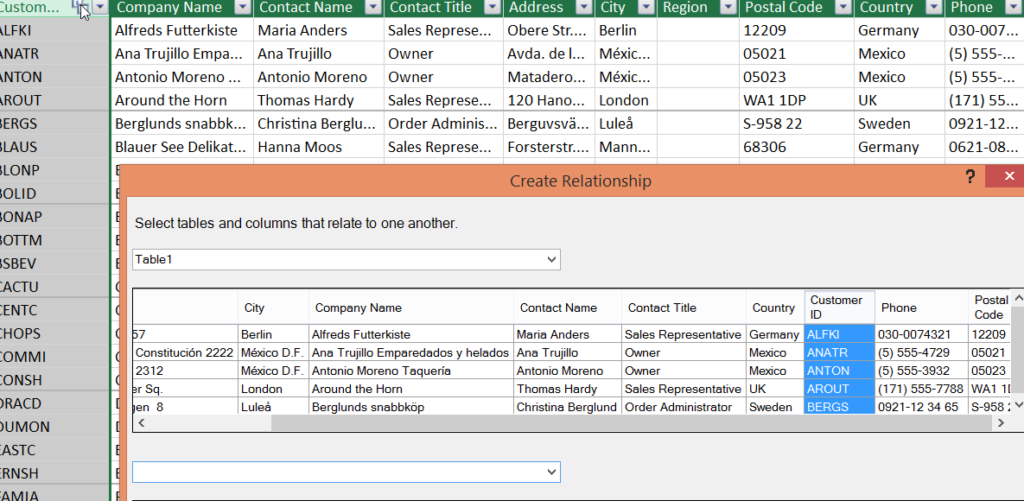
To sum up, the main point of using Power Pivot is to be able to “relate” or blend data sets together. To do this, once you have the Power Pivot window open, you can easily go to ‘diagram mode’ in the top right corner of your toolbar, and begin to build relationships between the different tables (similar to primary and secondary keys in SQL). All you need to do to make relationships is to highlight one of the columns in the card view, and then click and drag the connector to the other table you want to relate.
Once that’s done, you go back to your Power Pivot window and can select and engage with your relationship.
Finally, you can easily create a pivot table (in the Power Pivot window), which will bring you back to normal Excel workbook. However, now you have access to multiple worksheets that you can pull from. This is the power of Power Pivot!!
One last thing that this awesome section brings up is KPIs in Power Pivot. You can build custom calculations in Power Pivot, which allows you to use them within the pivot table.
Next, once you have your metric you click on the ‘Create KPI’ button and a window will pop up like below.
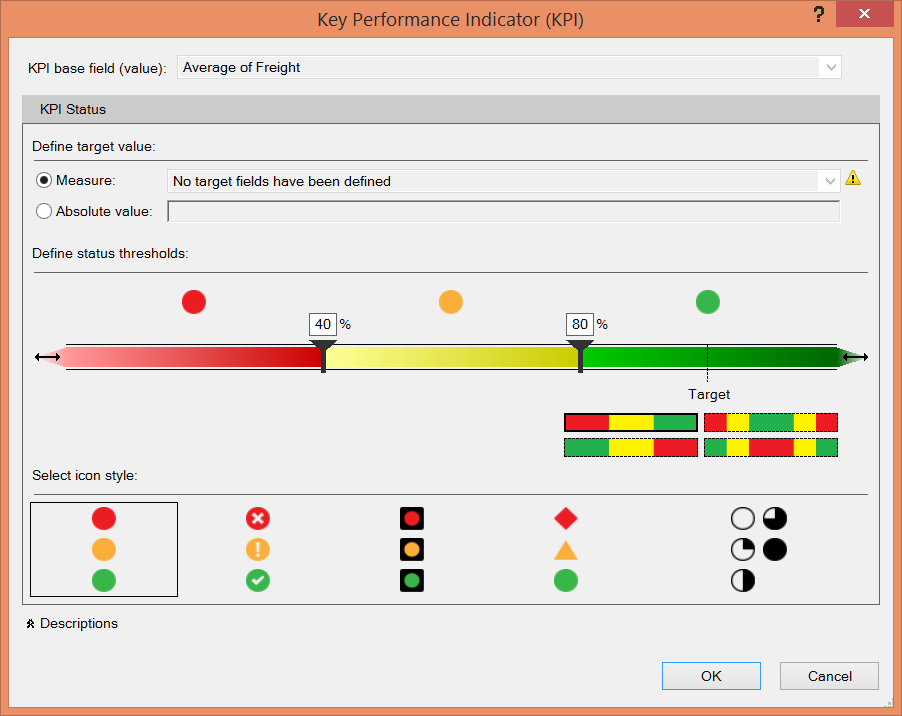
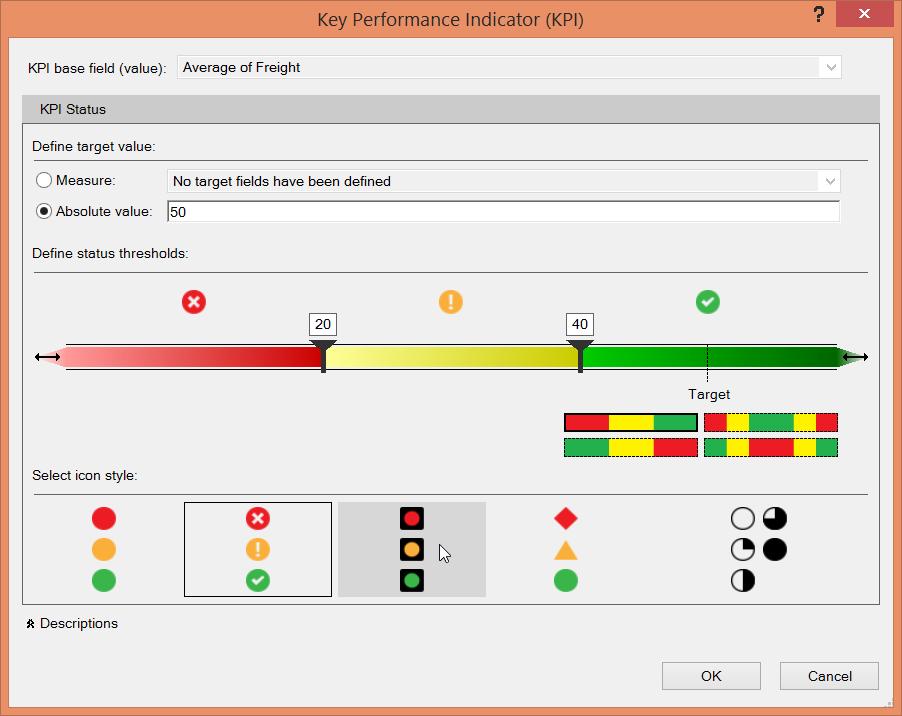
This is where some subjectivity comes in: You’ll need to think of the ranges for your KPI. Once your KPI is configured, you should see that the actual cell that had your original calculation has changed. If you head back to the pivot table you created earlier, you’ll see that there’s been an addition to your fields that you can add to your pivot table.
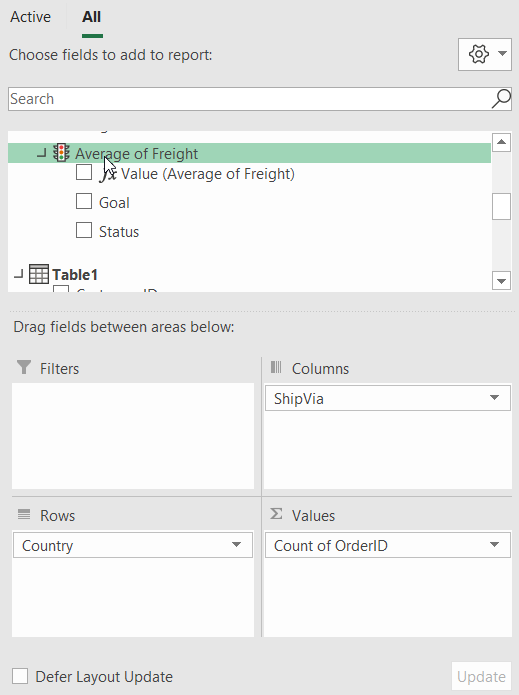
Once you add them in, and you’ve set the thresholds, your pivot table should look like this!!
Overall, I loved learning this for the first time – and I hope my walkthrough of this section actually helps make your decision to buy this course.
Section 19: Large data sets
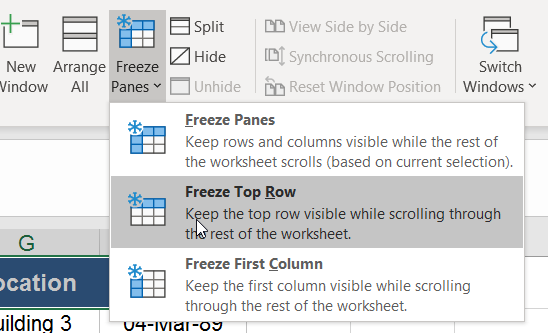
This section is about being able to navigate and adjust large sets of data. It’s fairly short and goes through things like using the Freeze Panes (basically making rows and columns fixed positions).
Kyle also goes through a number of other tools like how to print large data sets, grouping data in columns and rows, linking worksheets, and merging data from multiple worksheets. While a lot of this stuff is important, it’s not worth a ton a time investigating and are definitely a more “nice-to-have”.
Unit #3: Section 21 to 29 or Excel 103
Here’s where you want to pay attention and learn most of the things that will make you an Excel power user. This is where you’ll learn conditionals (IF(), AND(), OR()), nested functions or hybrid functions (COUNTIF, SUMIF, IFERROR), lookups (VLookup, HLookup, index, match), text-based functions like left(),right(), mid(), len(), concatenate(), “What if Analysis” / goal seek and scenario manager, and intro to macros.
This portion of the course reminded me of what’s required in the Excel Expert or MO-201‘s “advanced formulas and macros” portion. However, it is missing a few key components like WEEKDAY(), WORKDAY(), NOW(), TODAY(), and a few other things.
Section 22: Working with Excel’s conditional functions
This section is a good one, and if you have any coding skills you’ll find it super easy to pick up (especially with conditionals). This being said, the section opens with “named ranges”, which help with reference for functions instead of a cell reference. Kyle then cracks into the IF() function, which I use all the time.
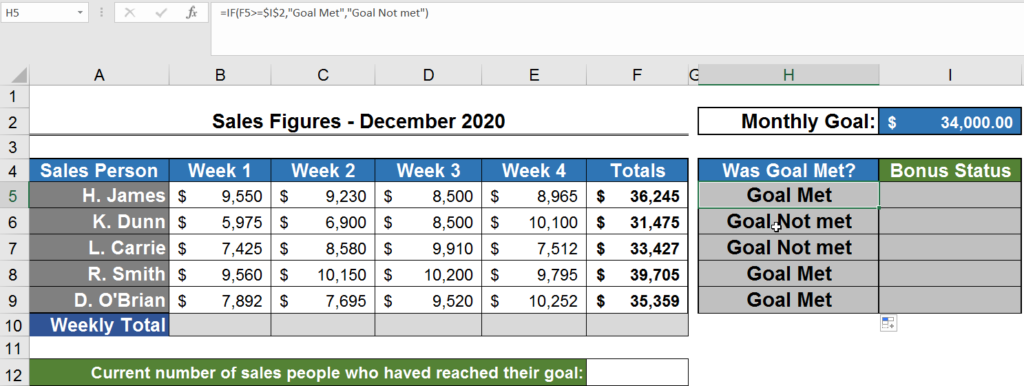
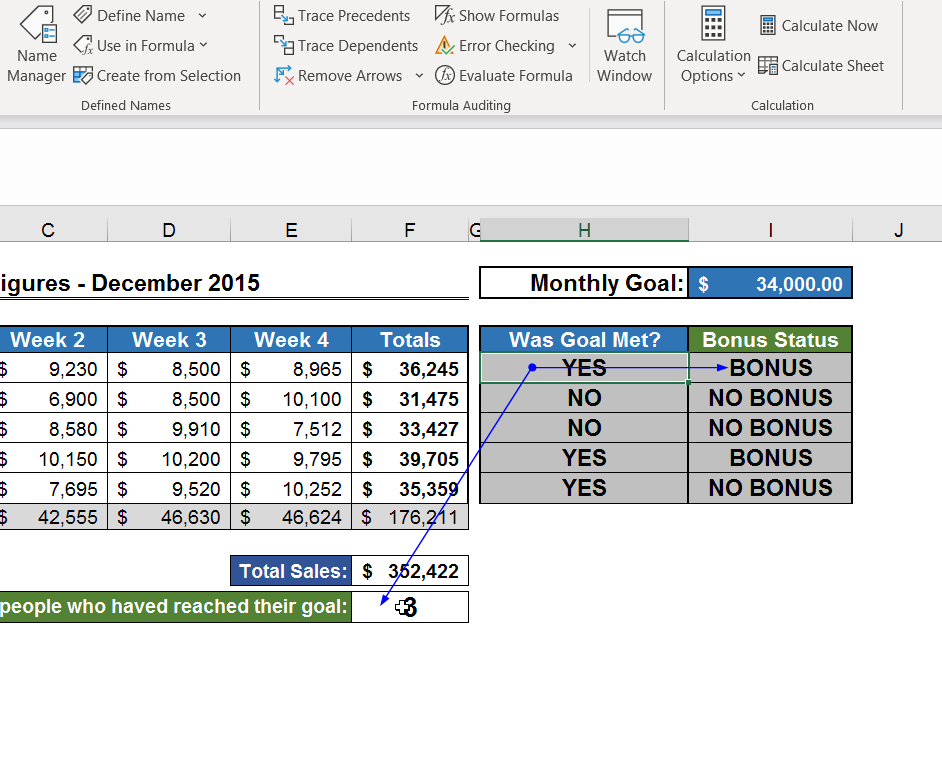
Basically, IF statements are super easy to use. Specify the condition and IF the condition is true, output something specific; if it’s false, output something specific. In the case below, I was checking to see if the sales people’s totals were greater than their monthly goals.
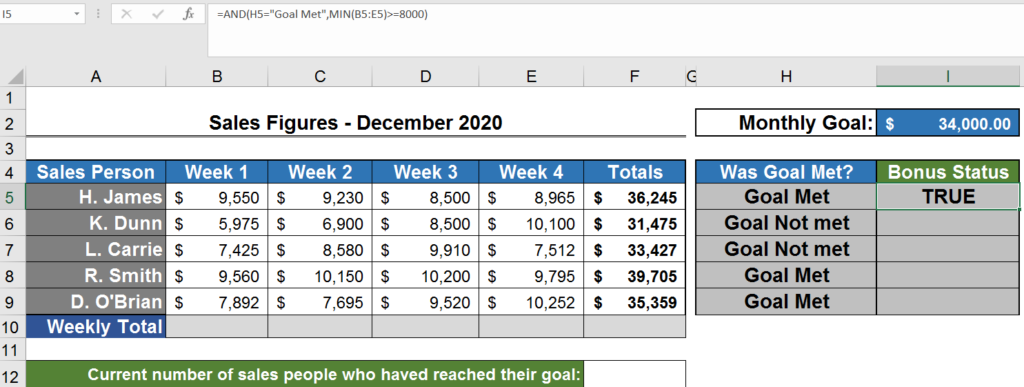
You can also add AND() / OR() conditionals into the function answer. Kyle does a great job combining functions, and with the AND() and MIN() functions to make using Excel more programmatic.
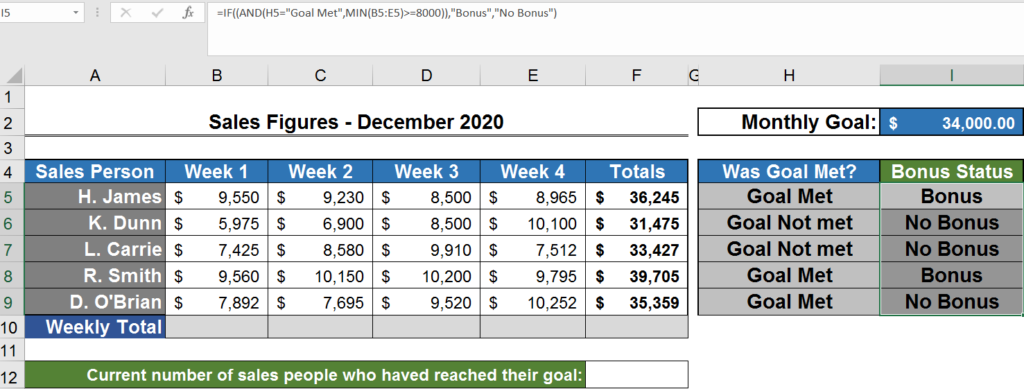
You can combine it all together with another IF to make it more presentable.
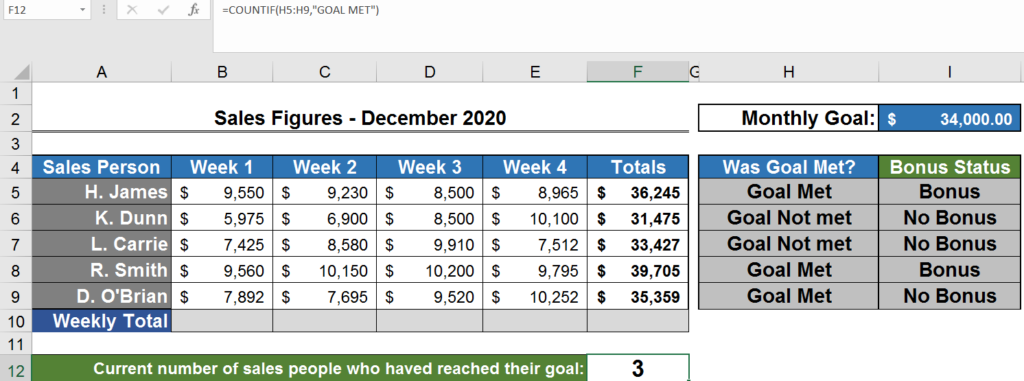
This section finishes with some of my favourite functions, including COUNTIF(), SUMIF() and IFERROR() – all conditional functions that will basically do something based on a condition. You can use the COUNTIFS(), SUMIFS() functions as well (when you have multiple criteria). So, to finish off the example, see the usage of countif below!
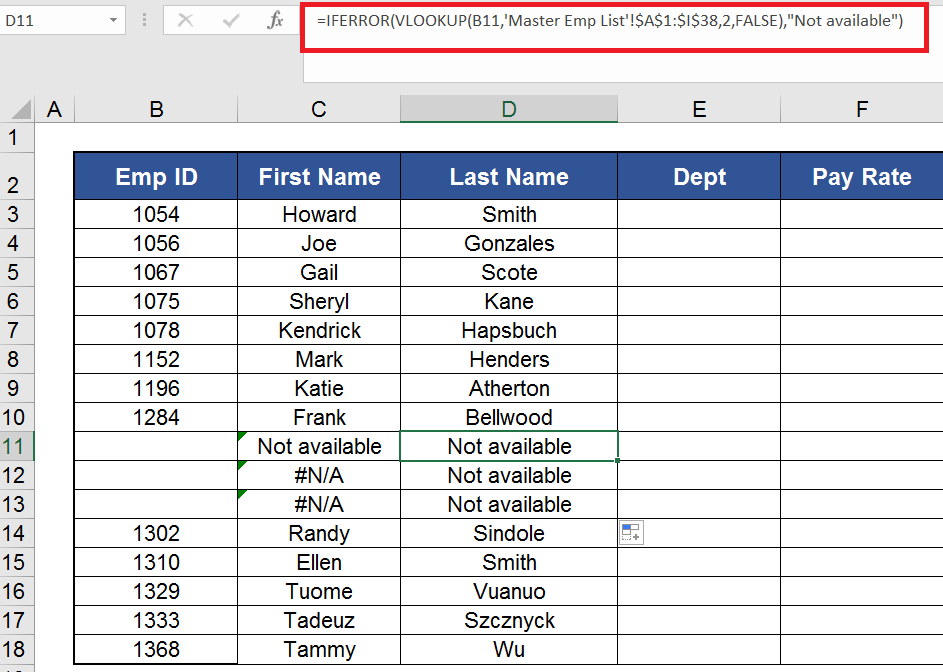
IFERROR() is a great function as it helps you show something other than a default Excel error. I use it ALL the time! See my example below.
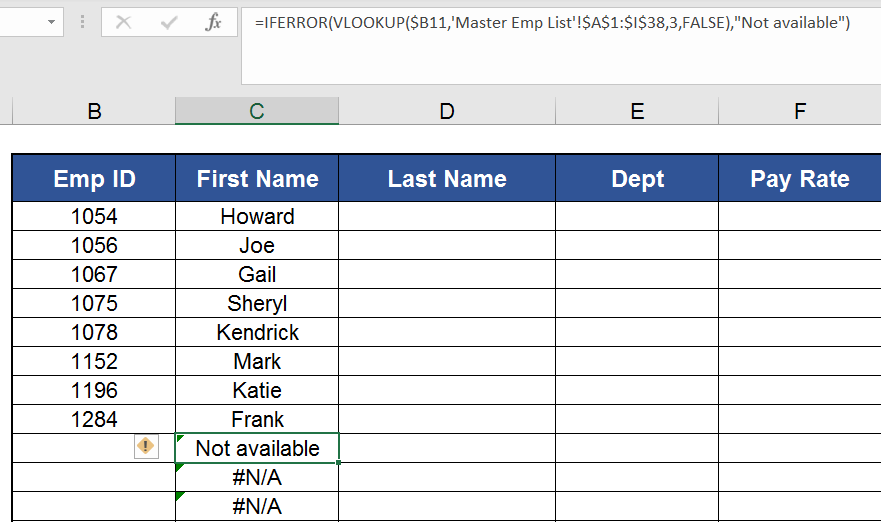
Section 23: Working with lookups
Holy cow, here’s where you’ll turn from knowing Excel to owning Excel 😉. These next few functions are what really allowed me to use Excel as a skill at work – more specifically, VLookup(), HLookup(), INDEX(), and MATCH(). You can also combine these to great effect.
I’ll break down each of them a tad from Kyle’s course so that you can see what you’re in for!
VLookup(): Vertical lookup, basically helps you match a (smaller) list of information vertically to another list. Usually, you’re looking for a subset of data from one table to another. Kyle does a great job with his worksheet, in sense that he will easily outline and dissect exactly how to construct the VLookup from scratch. Some common VLookup functions that you want to make sure you’re comfortable with are “IFERROR” and relative cells (your fancy $ signs).
HLookup(): Horizontal lookup, or a row lookup. It’s almost the exact same thing as VLookup, with the similar functionalities and values to pass to the functions. The only difference is that VLookup helps you search for records based off of columns, whereas HLookup helps you lookup based off of rows.
Note: Kyle does a fantastic job walking through how to do a VLookup and HLookup.
Index(): A very powerful lookup function. Has all the powers of VLookup, with none of the limitations (like having to call out specific columns to pull the data from, or one particular record).
One thing Kyle also advises is that a worksheet with a lot of VLookups can be particularly slow, which I didn’t know. Basically, for Index(), you will request a certain set of coordinates on array, and it will return you a value.
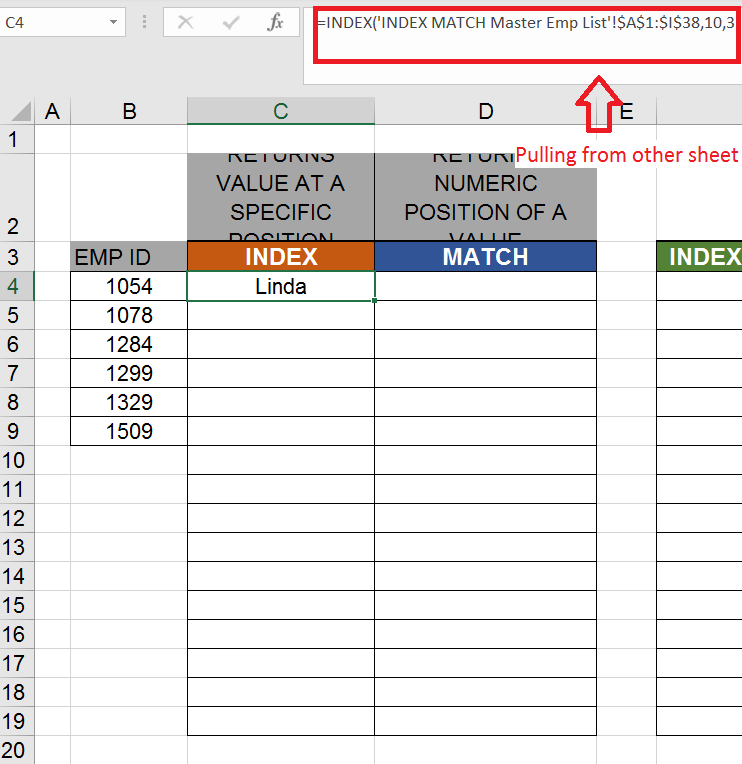
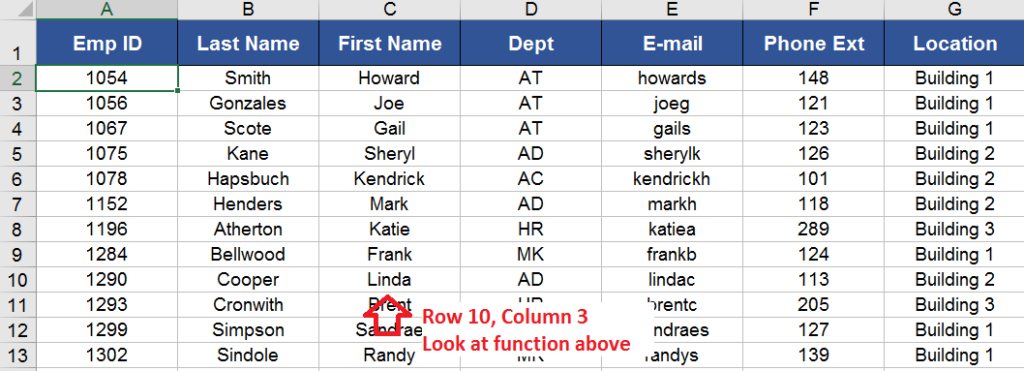
Match(): Match will look for a specific value in an array and return its position. Maybe you now have connected the dots as to why Index and Match combined are so powerful together! Match gives you the ability to search for a specific value in a range (whether it’s a row or column, but not an entire array). Essentially, I see it functioning similarly to a VLookup, but Match() (and Index() combined) give the relevant position and the value within the cell.
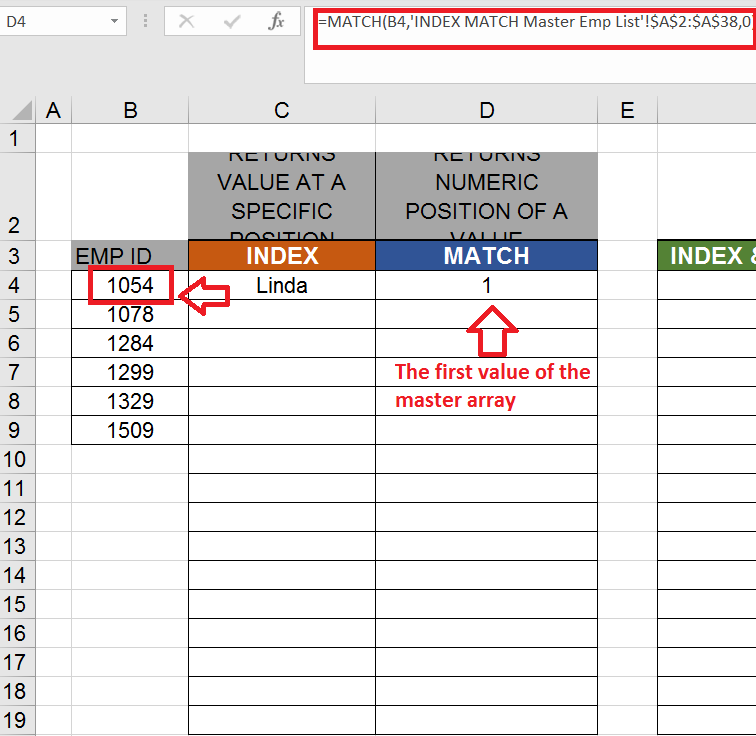
Putting Index() and Match() together
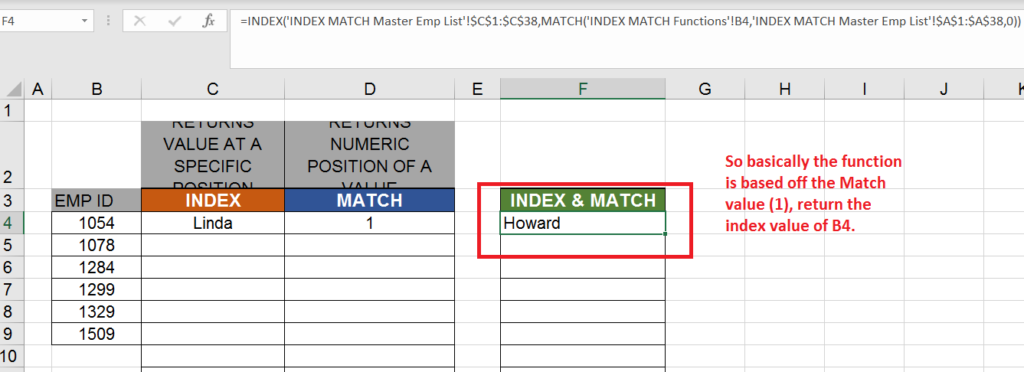
I think this is the best interpretation of Index() and Match() I’ve seen in a video. Kyle does an AMAZING job breaking down how each of them work, where to pull the information from, and what you should be seeing. Also, his worksheets are simple and easy to go through.
As a side, try to do the final two topics in this section thoroughly. They will really teach you the limitations of Match and Index, and some strong use-cases.
Section 24: Excel’s text functions
There’s nothing crazy about this section. If you’re used to using concatenate or SQL trimming functions like LEN, you won’t be learning anything new.
I do want to point out that Kyle’s analysis of the Search() function was spot on and it’s quite a useful tool when you’re trying to look for a specific portion of a cell.
Realistically, you won’t have to spend too much time on this section as you will rarely use the LEN, SEARCH, and trimming functions. Make sure you learn the concatenate function as it’s a great tool to combine content and normalize data appropriately.
Section 25: Auditing an Excel worksheet
Another very short section that explains more analysis of formulas and tracing dependencies.
I find that these functionalities, while important to know in Excel, don’t really help you when you’re BUILDING Excel spreadsheets. However, they’ll help you figure out a crazy Excel spreadsheet that one of your colleagues or friends made.
The tracing precedents and tracing formulas is what this is used for.
Section 26: Protecting Excel worksheets and workbooks
Another quick section that specializes in worksheets and workbooks, and locking them. Something you can easily Google and will take no time at all to master.
I would breeze through this section and Google if you need help on how to do these specific functions. This being said, locking cells in worksheets that traverse multiple departments and users is a pretty useful function. So I would at least watch this video.
Section 27: ‘What if’ tools
This is a very good section to watch. If you’re in finance, these tools are definitely important to know. The main purpose of ‘What if’ tools is to provide a way to quickly calculate different scenarios a user would use in Excel with different inputs.
The way I see it is, there’s an input field in Excel and there’s backend logic that outputs specific values based off a criteria set in the actual ‘What if’ analysis.
This is very similar to basic field submission forms you might build in coding bootcamps. The course goes over Excel’s Goal Seek tool, Solver tool, and the Scenario Creator (which is my favourite). Let’s dig into each.
- Goal Seek tool: First, create a general equation that you would want to build.
So in this course’s case, it’s a mortgage payment.
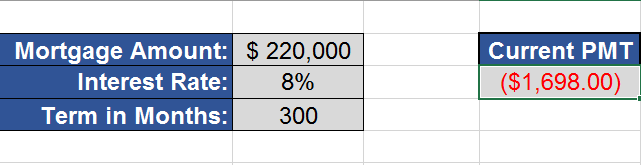
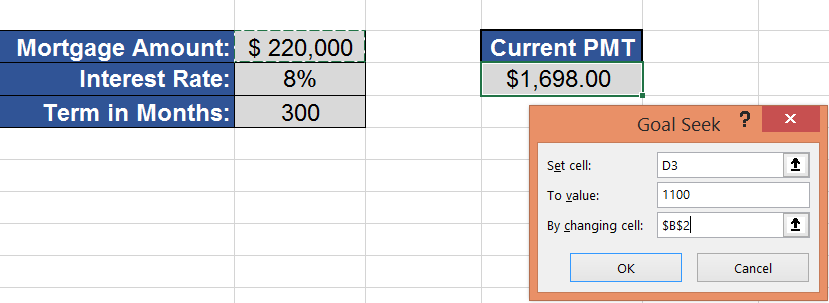
Next, you’ll want to go into the navigation, select “What if” analysis, and toggle to Goal Seek.
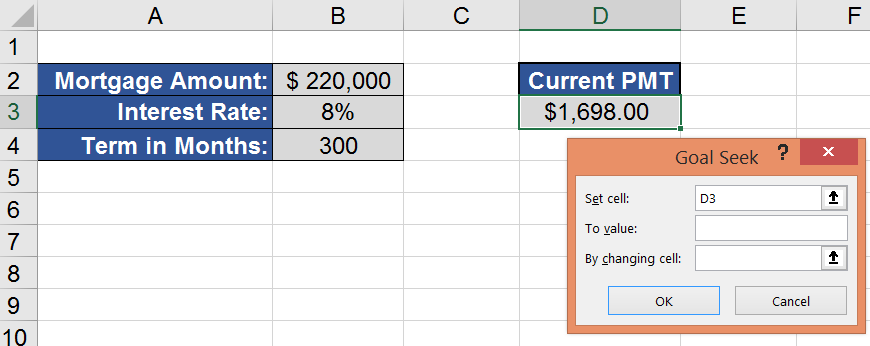
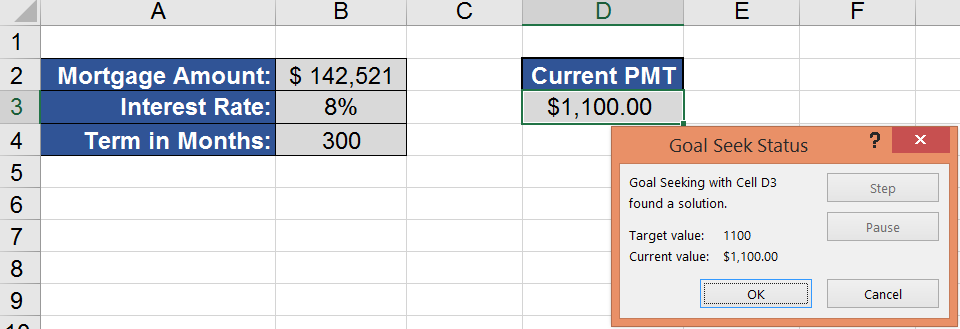
Next, fill out the values in Goal Seek, choose your target and what you want it to be at, and what value you want to change. And voilà – Excel will give you the relevant calculation.
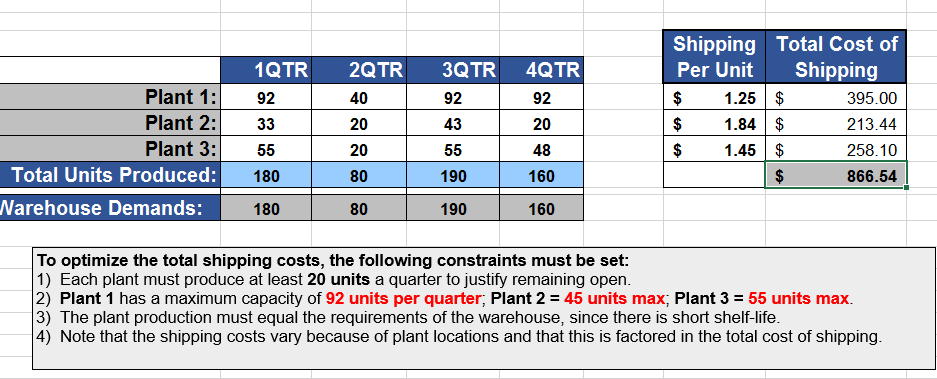
Solver tool: The Solver tool is very similar to the Goal Seek tool. However, Goal Seek only allows you to change one variable at time. While this is great, the Solver tool allows you to change multiple variables at the same time. Therefore, if you have multiple constraints and multiple values, you would want to use the Solver tool versus the Goal Seek.
Kyle’s course gives a good example of this.
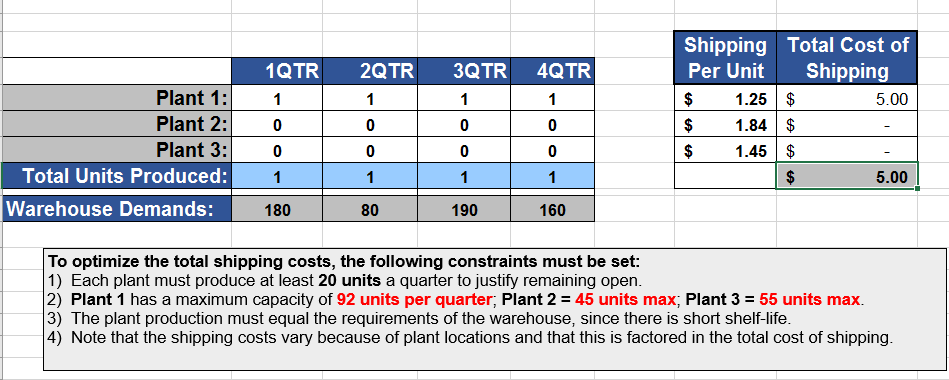
First, make sure that in Excel options, your “Solver Add-in” tool is actually enabled. In 2019 Excel, this was automatically enabled for me.
Next, you’ll want navigate to the ‘Data’ tab and start filling out the information. There are three things you’ll want to select with the Solver tool: “Set Objective”, “Changing Variable Cells”, and “Subject to the Constraints”. The interface is pretty intuitive.
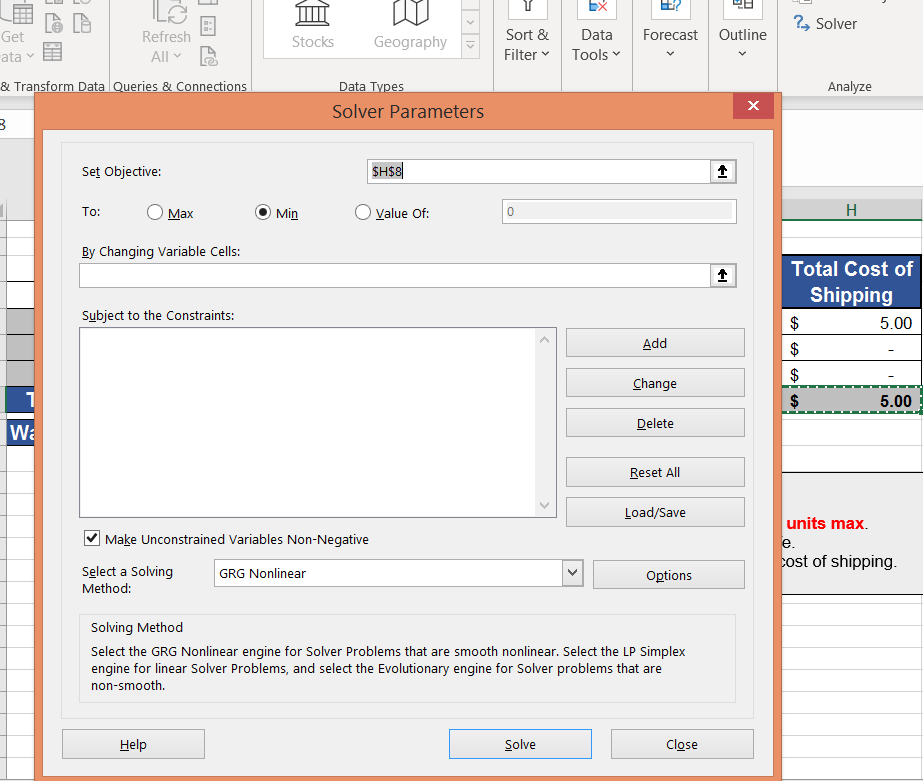
Add your target cells and the overall objective cell (where you want it to change). Next, add your constraints (this can take some time, but will be worth it in the end!).
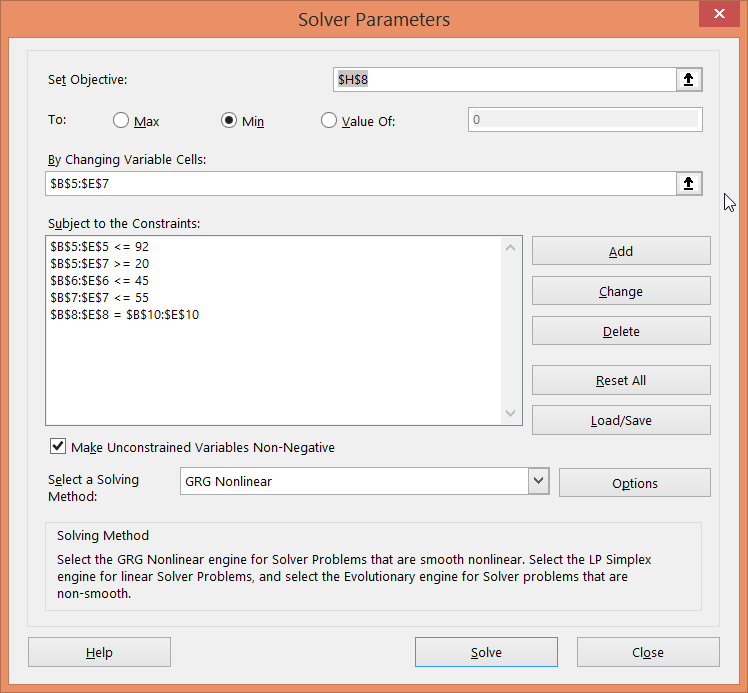
Submit everything and hit “Solve”. Voilà – you have your data solved!
Scenario creation: Last but not least is the scenario manager! This allows you to set a variety of scenarios for a certain set of cells. This is better than using multiple worksheets to show scenarios OR having to lookup the information. Select the cells you want to use for scenario manager, and just like the Solver tool – you need to add the relevant rows.
Once you add the relevant scenarios, you can toggle between them easy enough!
Section 28: Automating repetitive task in Excel with macros
This section is an introduction to Excel macros. One of the most exciting portions of this course, this is just an introduction to what macros are, how they work, how to edit them, record them, and how to actually build basic macros! If you’ve used macros before (at any level in Excel), you should be able to breeze through this content and section. However, it’s a great transition into Kyle’s fabulous Excel walkthrough, talk-through of VBA and macros in Excel.
Kyle will give little tips like “having no spaces in the macro names” and using proper shortcut keys. Always give strong descriptions for macros – it’s like providing proper comments for code. This section ends with adding your own macro to format a table and then adding a button to trigger that.
Section 29: You’re finished learning advanced Excel
Overall, I loved this section and I think it encompasses everything you need to become quite the Excel power user. From the lookups to “what if” analysis, if you learn these skills you should be comfortable with advanced Excel applications. The course also does a solid job at providing you with a number of high-quality worksheets that are easily changeable so you can practice the concepts and then build your own functions.
Section 30 to 39: Macros (Extra!)
I had very little experience going into this final section, and macros and VBA in general, but Kyle did a stellar job at explaining to a noobie like myself a rather technical concept. He breaks each section into automation tasks that you would see everyday as a power user in Excel. I won’t add anything about the individual sections because this article is long enough. However, I do believe that while Kyle does a good job explaining and showing you VBA, if you have no experience with coding or macros, the concepts could be hard to grasp.
Final summary of Kyle Pew’s Excel Udemy Course
Overall, Kyle Pew’s Excel Udemy Course was a blast and helped me refresh a lot of my unpolished Excel skills and learn a few new tips and tricks. The lookups, index, and pivot table I had prior experience with, but not so much with Power Pivot, D-functions, and VBA / macros. It was a great course to generally learn A LOT about many things in Excel, which makes it good for earning Excel certifications offered by Microsoft.
This is also a perfect tool for those who aspire to learn Excel from scratch, those who are looking to refine their skills (like me), or individuals who want to hone their skills for a certification. Personally, I think it’s always worth it to try doing new things in Excel and you can only get better by learning and doing!
Rating: I would give this course a 4.9/5 stars, due to its comprehensiveness and structure.
I hope you liked my review and happy learning! Feel free to leave a comment below. I have also added a general review of Udemy courses and whether they are accredited and even worth the money you spend.
Overall, I would say Udemy Excel courses are quite good for what you pay for. Lynda, Masterclass, and Coursera are mostly all subscription-based services, so you don’t get to keep the courses after, whereas with Udemy you do (which means you reap the benefit of seeing updates to the content).
I think it’s safe to put it on your resume if you don’t have anything else to prove your Excel skills. This being said, I would aim to conquer something more qualitative like MOS certification from Microsoft (which is done in a timed testing environment).
Excel Udemy courses usually cost between $9.99 – $14.99 USD. Sometimes the prices spike to well over $200 USD, but this is infrequent and often done to drive up overall conversions during the “sales” period.
These courses can cover data analysis, VBA / macro development, business analytics, financial analytics, and even Excel for engineering.
Amazing blog! Do you haave any suggestions for aspiring writers?
I’m planning to styart my own blog soon but I’m a
little lost on everything. Would you advise starting with a frse platform like WordPress or go forr a paid option? There
are so many choices out tere that I’m completely confused ..
Any suggestions? Thanks!
I have been browsing online more than 4 hours today, yet I never found any interesting article like yours.
It’s pretty worth enough for me. In my opinion, if all website owners and bloggers made good content as you did, the net will
be a lot more useful than ever before.
Howdy! Someone in my Facebook group shared this website
with us so I came to look it over. I’m definitely enjoying the information.
I’m book-marking and will be tweeting this to my followers!
Fantastic blog and fantastic design and style.
I have read so many content on the topic of the blogger lovers however this article is genuinely a nice piece
of writing, keep it up.
Wow, this article is good, my younger sister is analyzing these things, so I am going to tell her.
Thanks Lucile, please do share with her and let me know if you have any questions on Excel or Udemy!
nice post, thank you for sharing